“I wisely started with a map, and made the story fit.”
— J. R. R. Tolkien, 1954
Well met, traveller! Please, take a seat by the fireplace, make yourself comfortable, warm your weary feet, and listen to my tale — a tale where modern geographic information systems and computational science meet cosy forest glades carpeted with moss and fern, where elves are still fond of wandering beneath the trees and, of course, beneath the stars.
Some time ago, I came across a newspaper article describing a peculiar project by several scientists: launching a numerical climate model (also called a General Circulation Model) over the fictional continent of Middle-earth (ME) to see the long-term performance of weather; observing the patterns of wind or precipitation shaping the steep and goblin-populated slopes of the Misty Mountains. “Wow, that’s so cool. One can probably find out a lot of the additional interesting information – where the best living spots or the best regions to grow corn are, or where flash floods, like Elrond’s one, will occur, ” I was saying to myself, a little bit afflicted by my occupation, during which I have to think about climate data as input for environmental or agricultural issues. So as you can see, I am on the opposite end of the pipeline from scientists creating tuned climate compositions — kind of symphonies, where pressure, temperature, and moisture together awaken a vast geospatial drama of moving air masses, cyclones, and atmospheric waves, yet somehow preserve a certain harmony. On the one hand, it is completely sci-fi to me and a little bit of a black box; on the other hand, I started to wonder how you can easily run a climate model on your own over fantasy worlds, without the necessity of using supercomputers (Numerical climate models require enormous computational power). And after a while, I am ready to write about my experience: not about composing climate symphonies, but perhaps something more like a climate rhapsody. 🎼
(Btw, it makes sense to talk about music, because Tolkien would love it, hm? 😮)
You will find in this post:
- Short history of climate modelling over fantasy worlds
- Digital Elevation Model (DEM) wrangling and tuning
- DEM visualization and information about the Fellowship of the Ring’s journey
- Bivariate temperature and precipitation maps
- Holdridge Life Zones in the ME
- Köppen–Geiger climate groups in the ME
- Topographic Wetness Index (TWI) in the ME
- What else can be done relatively easily?
- Let’s play One Ring tabletop role-playing game with it!
- Future approach to modelling
Why even try to model anything in Middle-earth when we have Ilúvatar?
Let’s step back before diving into geospatial processes, and let’s shortly discuss the question of meaningfulness. So why spend precious time creating something scientific in a fictional world? Reading Ray Bradbury’s book, Zen in the Art of Writing (essay, “On the Shoulders of Giants”), probably gives a quick answer: Science fiction (and fantasy) is a history of ideas on how to survive, incarnated. In other words, solving real-life issues can be viewed as swallowing Sci-Fi thoughts. Boom! So we can say without hesitation: A simulation of Climate in the LOTR universe could be beneficial for future ideas on how to perceive global interconnected issues. Simple as that! But is it?
Another quite important pro argument would be that Tolkien himself just found out that storytellers are subcreators, and the process of creating secondary realms is chained to laws according to which we and our world are created. All fictional worlds are “subject to God’s will“and fictional realms should have internally consistent laws. That’s maybe something that Marie-Laure Ryan described as the “principle of minimal departure” – an arising alternate world of a writer will highly probably be reconstructed as being the closest possible to the reality we know. That’s quite a bold claim, isn’t it? However, it makes sense if you go through all successful secondary worlds and their internal laws.
Moreover, modelling of fictional climate can have one more easily overlooked aspect, and that’s education. 👨🏫
What led Radagast the Brown to run a climate model over Middle-earth?
On December 3 2013, quite a bizarre scientific (mock) manuscript emerged in scientific literature, signed by Radagast the Brown from Rhosgobel, nr. Carrock, Mirkwood, Middle-earth. The paper was prepared for J. Hobbitlore, and it described the launch of HadCM3, a coupled atmosphere-ocean general circulation model (AOGCM), over the topography and bathymetry of Arda.

Is this guy launching the climate model? (Radagast played by Sylvester McCoy)
In fact, the author’s real name is Dan Lunt, and he is a Professor of Climate Science at the University of Bristol. As a huge fan of The Lord of the Rings, he decided to find out what weather patterns can be found in the regions of Middle-earth. Because he is used to modelling the climate of the Earth millions of years ago, when the shapes of continents were completely different, it was not unusual for him to prepare the data and launch the model over the fictional world. For such a demanding project, he used the computational power of a supercomputer, and it was successful in many ways. Mainly, the project demonstrated that climate models are not simply statistically tuned to reproduce the climate of modern Earth, but are fundamentally based on physical laws. This means they can be applied to entirely different worlds, including fictional ones such as Middle-earth. The project quickly caught the attention of the media, but perhaps more importantly, it was embraced by many enthusiastic teachers who used it in their classrooms to introduce students to climate science and explain complex climate processes in an engaging way. 🤓
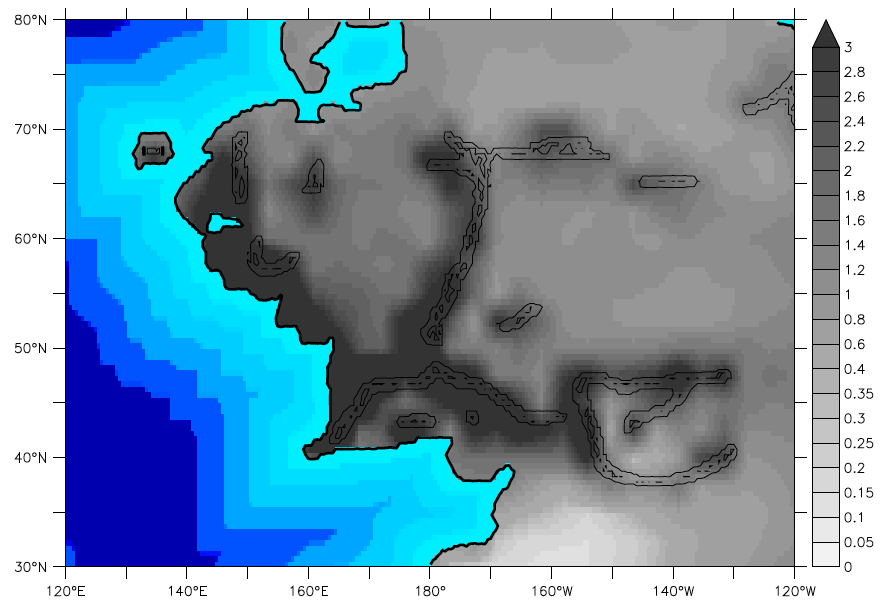
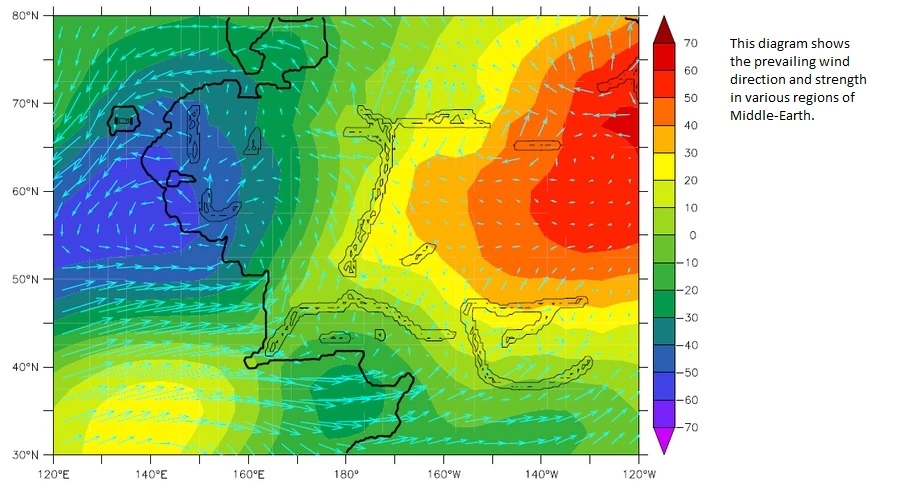
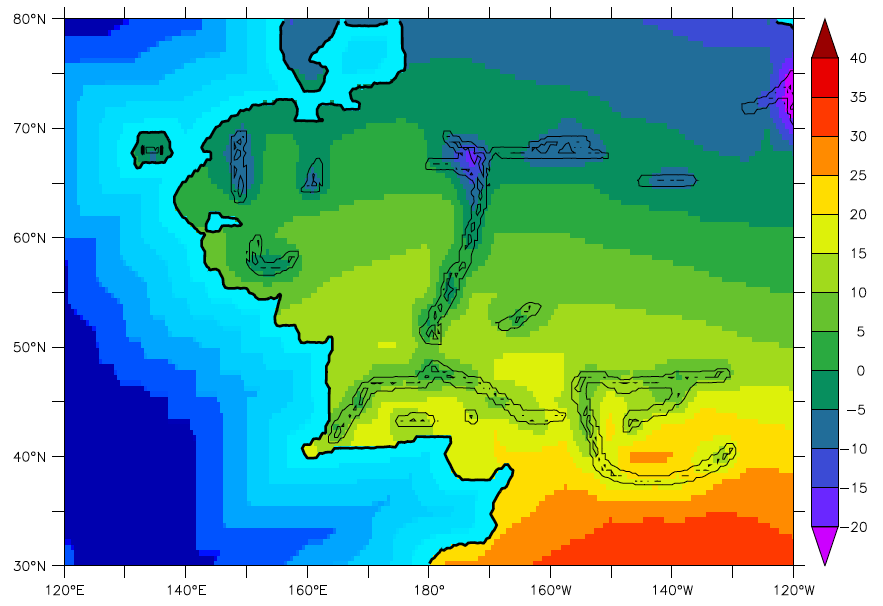
Outputs of the HadCM3 Climate model of Middle-earth: a) precipitation [mm/day], b) Surface winds and mid-atmosphere pressure, c) Temperature [°C] (Dan Lunt, 2013)
Which mortal has already tried to play at being one of the Valar or Maiar?
Since then, there have been only small trials to advance with climate projects in Tolkien’s realm. Most of them, however, have relied on qualitative and heuristic approaches, rather than numerical climate modelling or data-driven geospatial analysis. You will probably find some of them on Reddit or in the form of blog posts. However, until February 2026, nobody else was bothered by this topic. That month, Dan Lunt published a new paper about climate modelling over Middle-earth, and at that time he was joined by a larger scientific team trying to launch different climate models over the different fantasy realms, namely Song of Ice and Fire or Wheel of Time. Most importantly, John Cook from the University of Melbourne and founder of the Skeptical Science webpage took care of the explanatory aspects, which already involved social, cultural, and worldbuilding findings and interpretation (some of them can already be found in this text). Cook et al. also encourage using simple and easy-to-run GCM climate models as powerful explanatory tools not only by worldbuilders, but also by book authors, game developers, and screenwriters to achieve world-building mastery. So, that’s a good reason to give it a shot! Agree? And maybe there is also an even easier level of how to make your precipitation and temperature maps than using GCM as I already indicated at the beginning.
Do I need Blender, Glamdring or Maltar for modelling?
For starters, you need the courage and patience of Samwise Gamgee. Working with geospatial data could be quite demanding. It is about moving two steps forward, one step back. What else? Let’s see the following list of necessary world-builder equipment:
- Digital Elevation Model, so-called DEM of your fictional realm or other format of topography (plus bathymetry). Luckily, a very good DEM is already there (link).
- Bitmap graphical editor (GIMP, Adobe Photoshop, Affinity Photo, Procreate, etc.) – Because adjusting terrain with several brush strokes can save you a lot of time.
- Geographical Information System (QGIS is enough) – For geospatial data wrangling, georeferencing, visualization of results, Cropping, merging, and other important processes
- Additional geological/geographical software – if you would like to start with creation of your DEM, then Wilbur or GPlates for creation of more immersive DEM make sense.
- R, Python and their geospatial libraries for scripted data processing and visualization tools (Rayshader library in R)
- Blender for visualization
- Lots of coffee — preferably cold brew when your brain is fried; ginger lemonade for a good mood.
So, as you can see, the list is quite demanding and full of specialized tools. Nevertheless, I think in the era of AI chatbots and copilots, it is quite feasible to handle a simple project.
The Forge of Aulë – Methods and Data Processing
Equipped with Aulë’s hammer Maltar, we can start to think about how to approach whole climate modelling. It should be noted that I will not go into detail and will stick with general ideas and methods, which were used during the preparation of the first outcomes. The description of every single step would take several pages of text and could be later published as a thesis. Nevertheless, I will try to briefly explain important parts.
So let’s assume that you have already prepared your DEM data (bburns/Arda) and they’re in some usable format (JPEG, PNG, GeoTIFF). The first important part is georeferencing, which will change an ordinary map into one where every pixel (grid cell) also holds information about its coordinates; in other words, where every pixel has its place in the real world. In our case, however, the pixels represent a fictional world, and we would like to attach them to our real one. Since Tolkien imagined Middle-earth as part of our world—essentially Europe several thousand years ago—we can continue with this idea. First, we need a little information about our DEM: the total image dimensions and the spatial resolution of a single raster cell in metres or kilometres. Additionally, from Tolkien’s writings and previous studies, we have approximate distances for several journeys—for example, Bilbo’s journey to the Lonely Mountain, the Fellowship’s journey towards Emyn Muil, or the distance between Hobbiton and Minas Tirith. We can use this information to anchor fictional locations in Middle-earth to real locations in Europe according to our preferences, while keeping the known distances in mind so that we do not produce an excessively skewed map. I decided to anchor the Shire to Tolkien’s home city of Oxford. The second point is then more constrained by the known distances: Minas Tirith, which I placed somewhere near Venice.
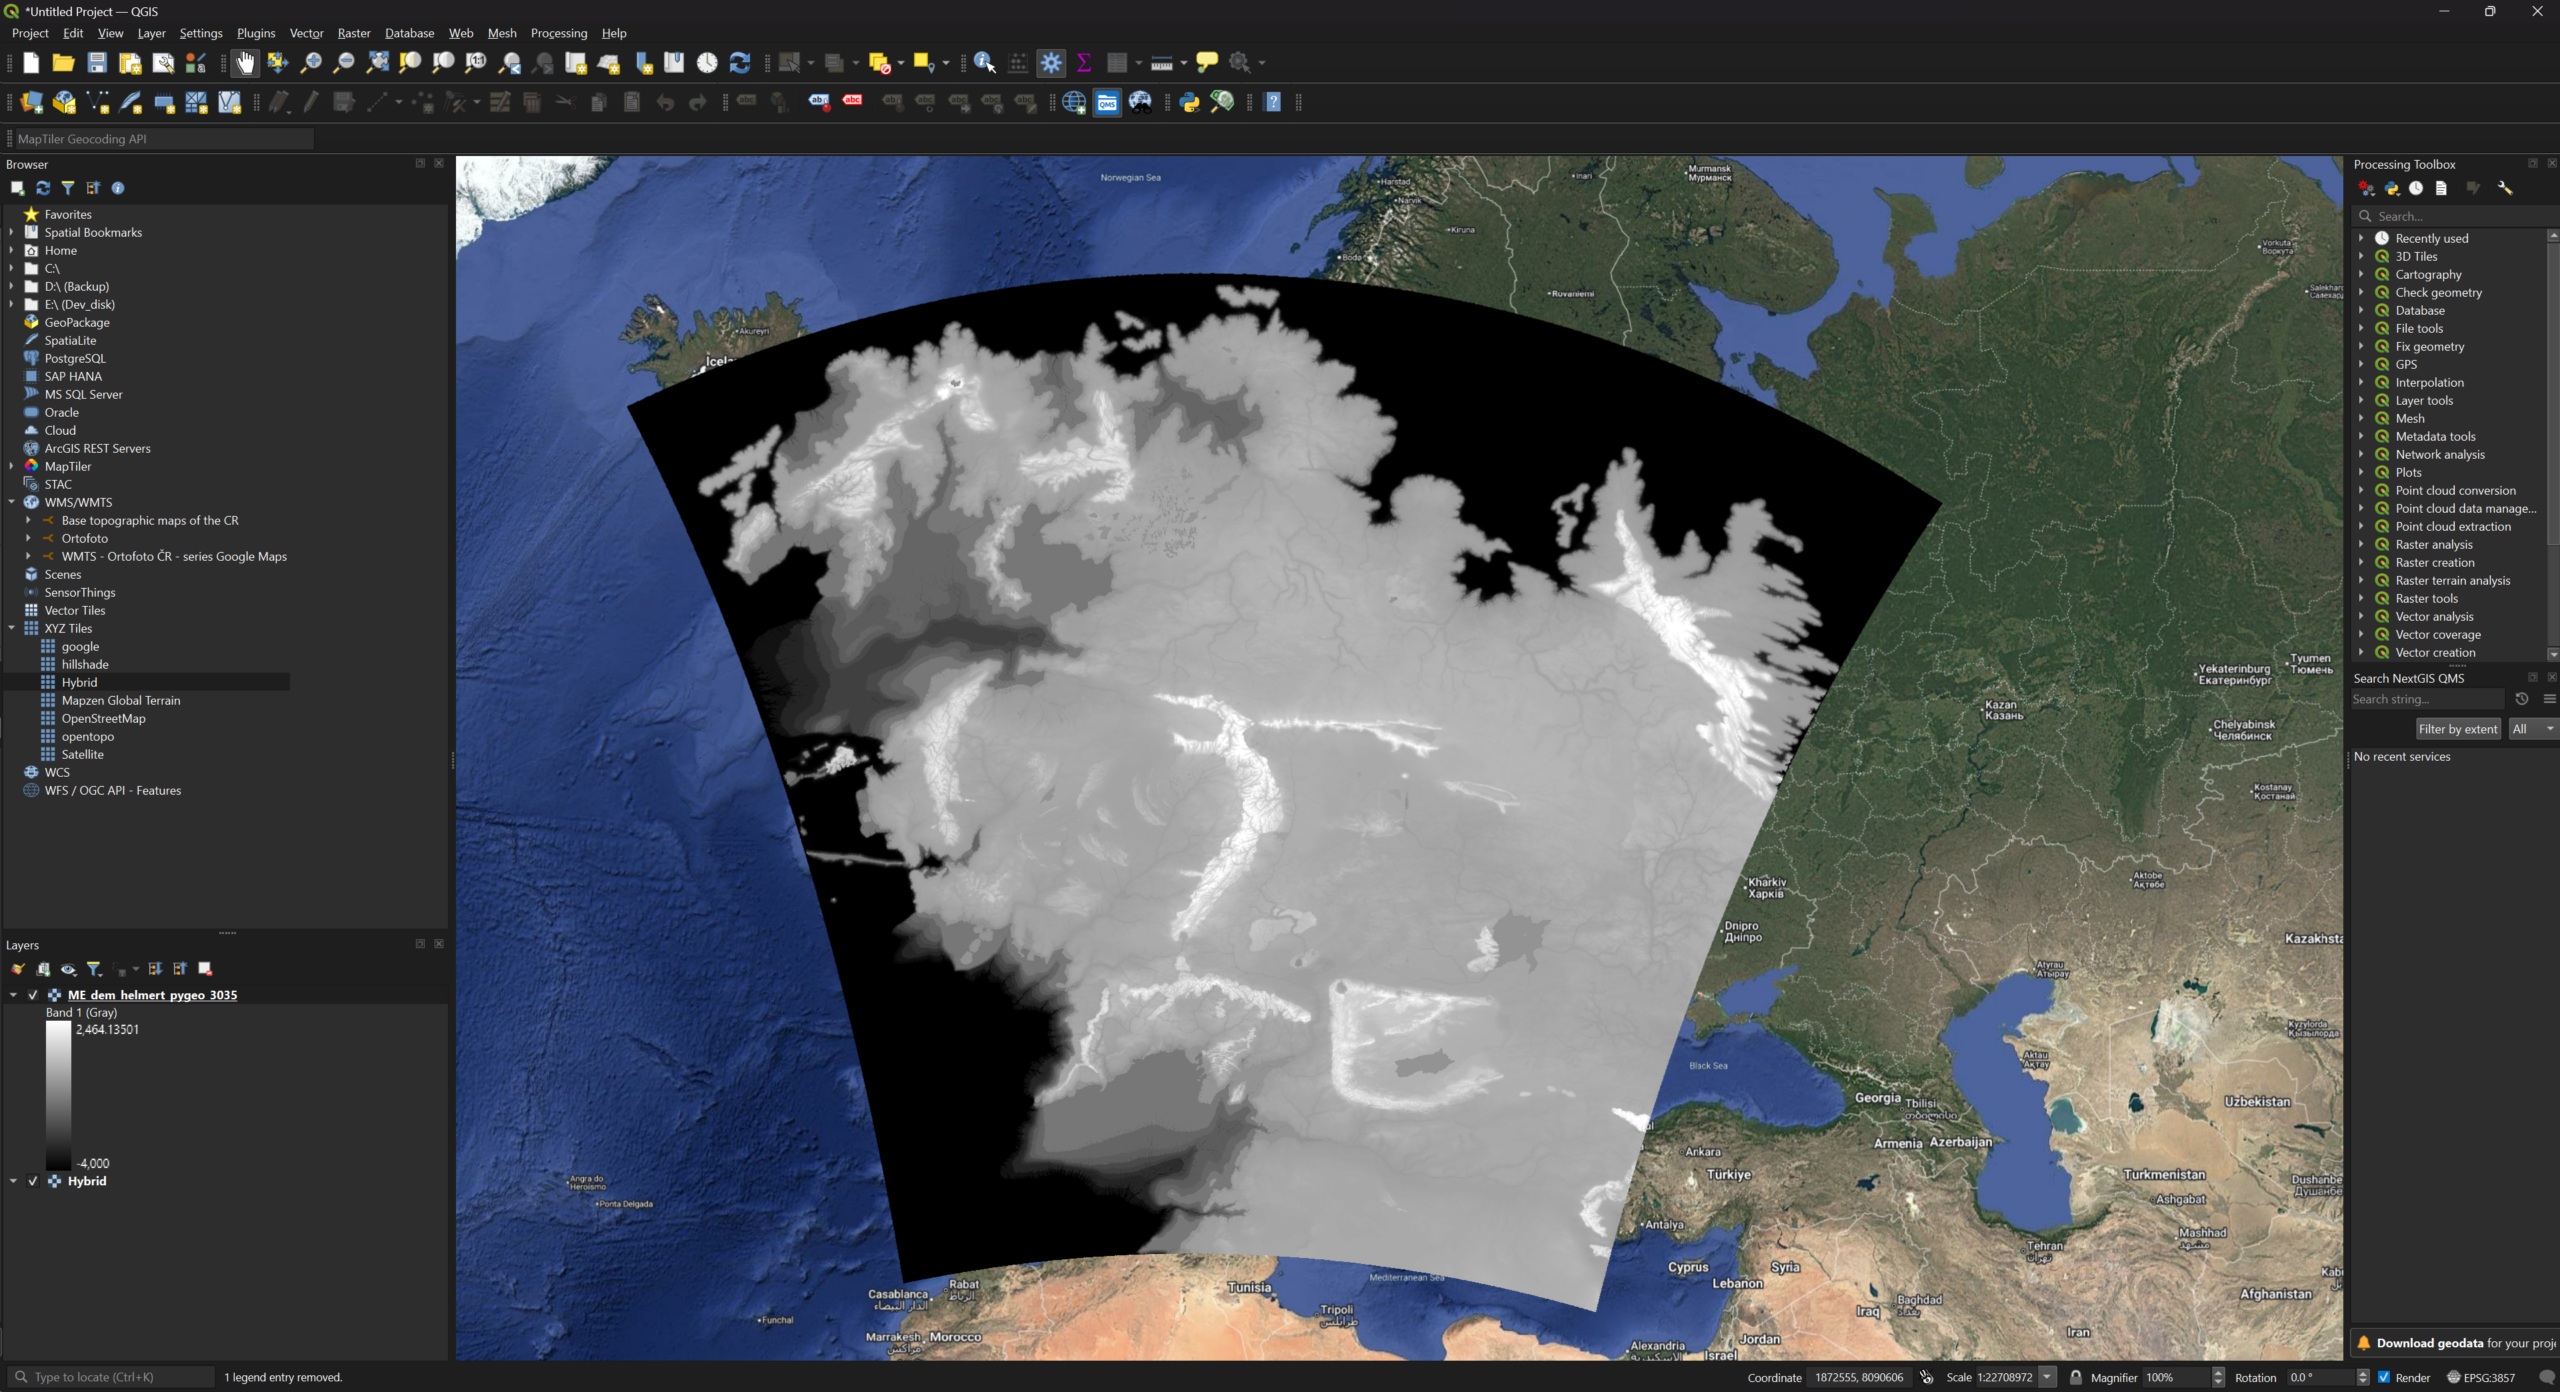
Georeferencing is one of the important steps
So you can see the result above – DEM georeferenced on the map of Europe. This outcome will allow us to easily use additional information – primarily latitude and distance for the next part. Our forging of climate can continue with defining what is important for us. Generally, almost all environmental aspects rely on two important variables: precipitation and temperature.
So now is the time to compose the core of our climate rhapsody and think about the main components. For this work, the information about the CHELSA v2.1 mechanistic, terrain-informed climate downscaling model could come in handy. The introduction of the model will tell you that it uses orographic factors (uplift, mountain mass), leeward drying, and valley shielding. Another important keyword is Continentality, which measures how much a region’s climate is influenced by its distance from large lakes, oceans, or seas. As we said, latitude is quite an important indicator for temperature, but precipitation is also strongly influenced by Hadley cells and subtropical high-pressure systems. All these aspects can be easily simulated by various functions, rule-based equations, and different kinds of filtering, and if you are using Python, you can rerun calculations easily and test different approaches.
So, for example, Continentality was calculated simply from the distance to the sea, with areas 900 km or more from the coast considered fully continental. A simple mathematical transformation was then used to make the transition from coastal to continental areas smoother. Another example could be Mountain mass – it was calculated from high-elevation areas, starting at around 700 m, and smoothed to represent larger continuous mountain ranges rather than individual peaks. This is important for estimating precipitation, as large mountain ranges strongly influence where moist air rises and rainfall occurs. See! You can think about all these aspects in a quite easy way!
Finally, we can try to calculate Precipitation. So it was estimated as the sum of several components representing base rainfall, moisture from the ocean, coast and lakes, and orographic rainfall caused by mountains, while rain shadows reduce precipitation on the leeward side. These components are further modified by latitude-dependent atmospheric circulation, particularly the drying effect of subtropical high-pressure zones.
P = Pbase + Pocean + Pcoast + Plake + Porographic + Pmountain − PshadowSo this is it! As you can see, climate can also be modelled using a heuristic, rule-based geospatial approach designed to produce physically plausible spatial patterns rather than simulate atmospheric dynamics.
flowchart TD
A["Outerra Picture (DEM) of Middle-Earth"] --> B["Adjusted and quickly fixed DEM"] --> C["Georeferenced DEM"] --> D["Auxiliary layers (e.g. Continentality)"]
E["Tolkien's Lore"] --> F["Descriptions of continents, tales, and rumors from the world of Middle-earth"] --> G["Basic rules and guidelines for modeling and rendering"]
G --> H["Modelling of temperature and precipitation layers"]
D --> H
H --> I["Geospatial layers (e.g. GeoTIFF, GeoPackage)"]
I --> J["Post-processing and visualization in R (Rayshader)"]
J --> K["Export final visualizations"]
I --> L["Location-based data for worldbuilding"]
A Digital Model of Middle-earth: What Can It Reveal About the Fellowship’s Journey?
Before checking the precipitation and temperature results, I will present some interesting information, which can be obtained from a quick analysis of the DEM and vector path representing the journey of Frodo & Sam. This small stop should only present what can be deciphered from the terrain and present the visualization capabilities of Rayshader. So the following 3d map shows what the terrain looks like according to the Arda’s creators. Isn’t it quite interesting? All these highlands, river streams, and regions, which are not present in Tolkien’s original maps. Of course, it is only an interpretation of ME, but well done!
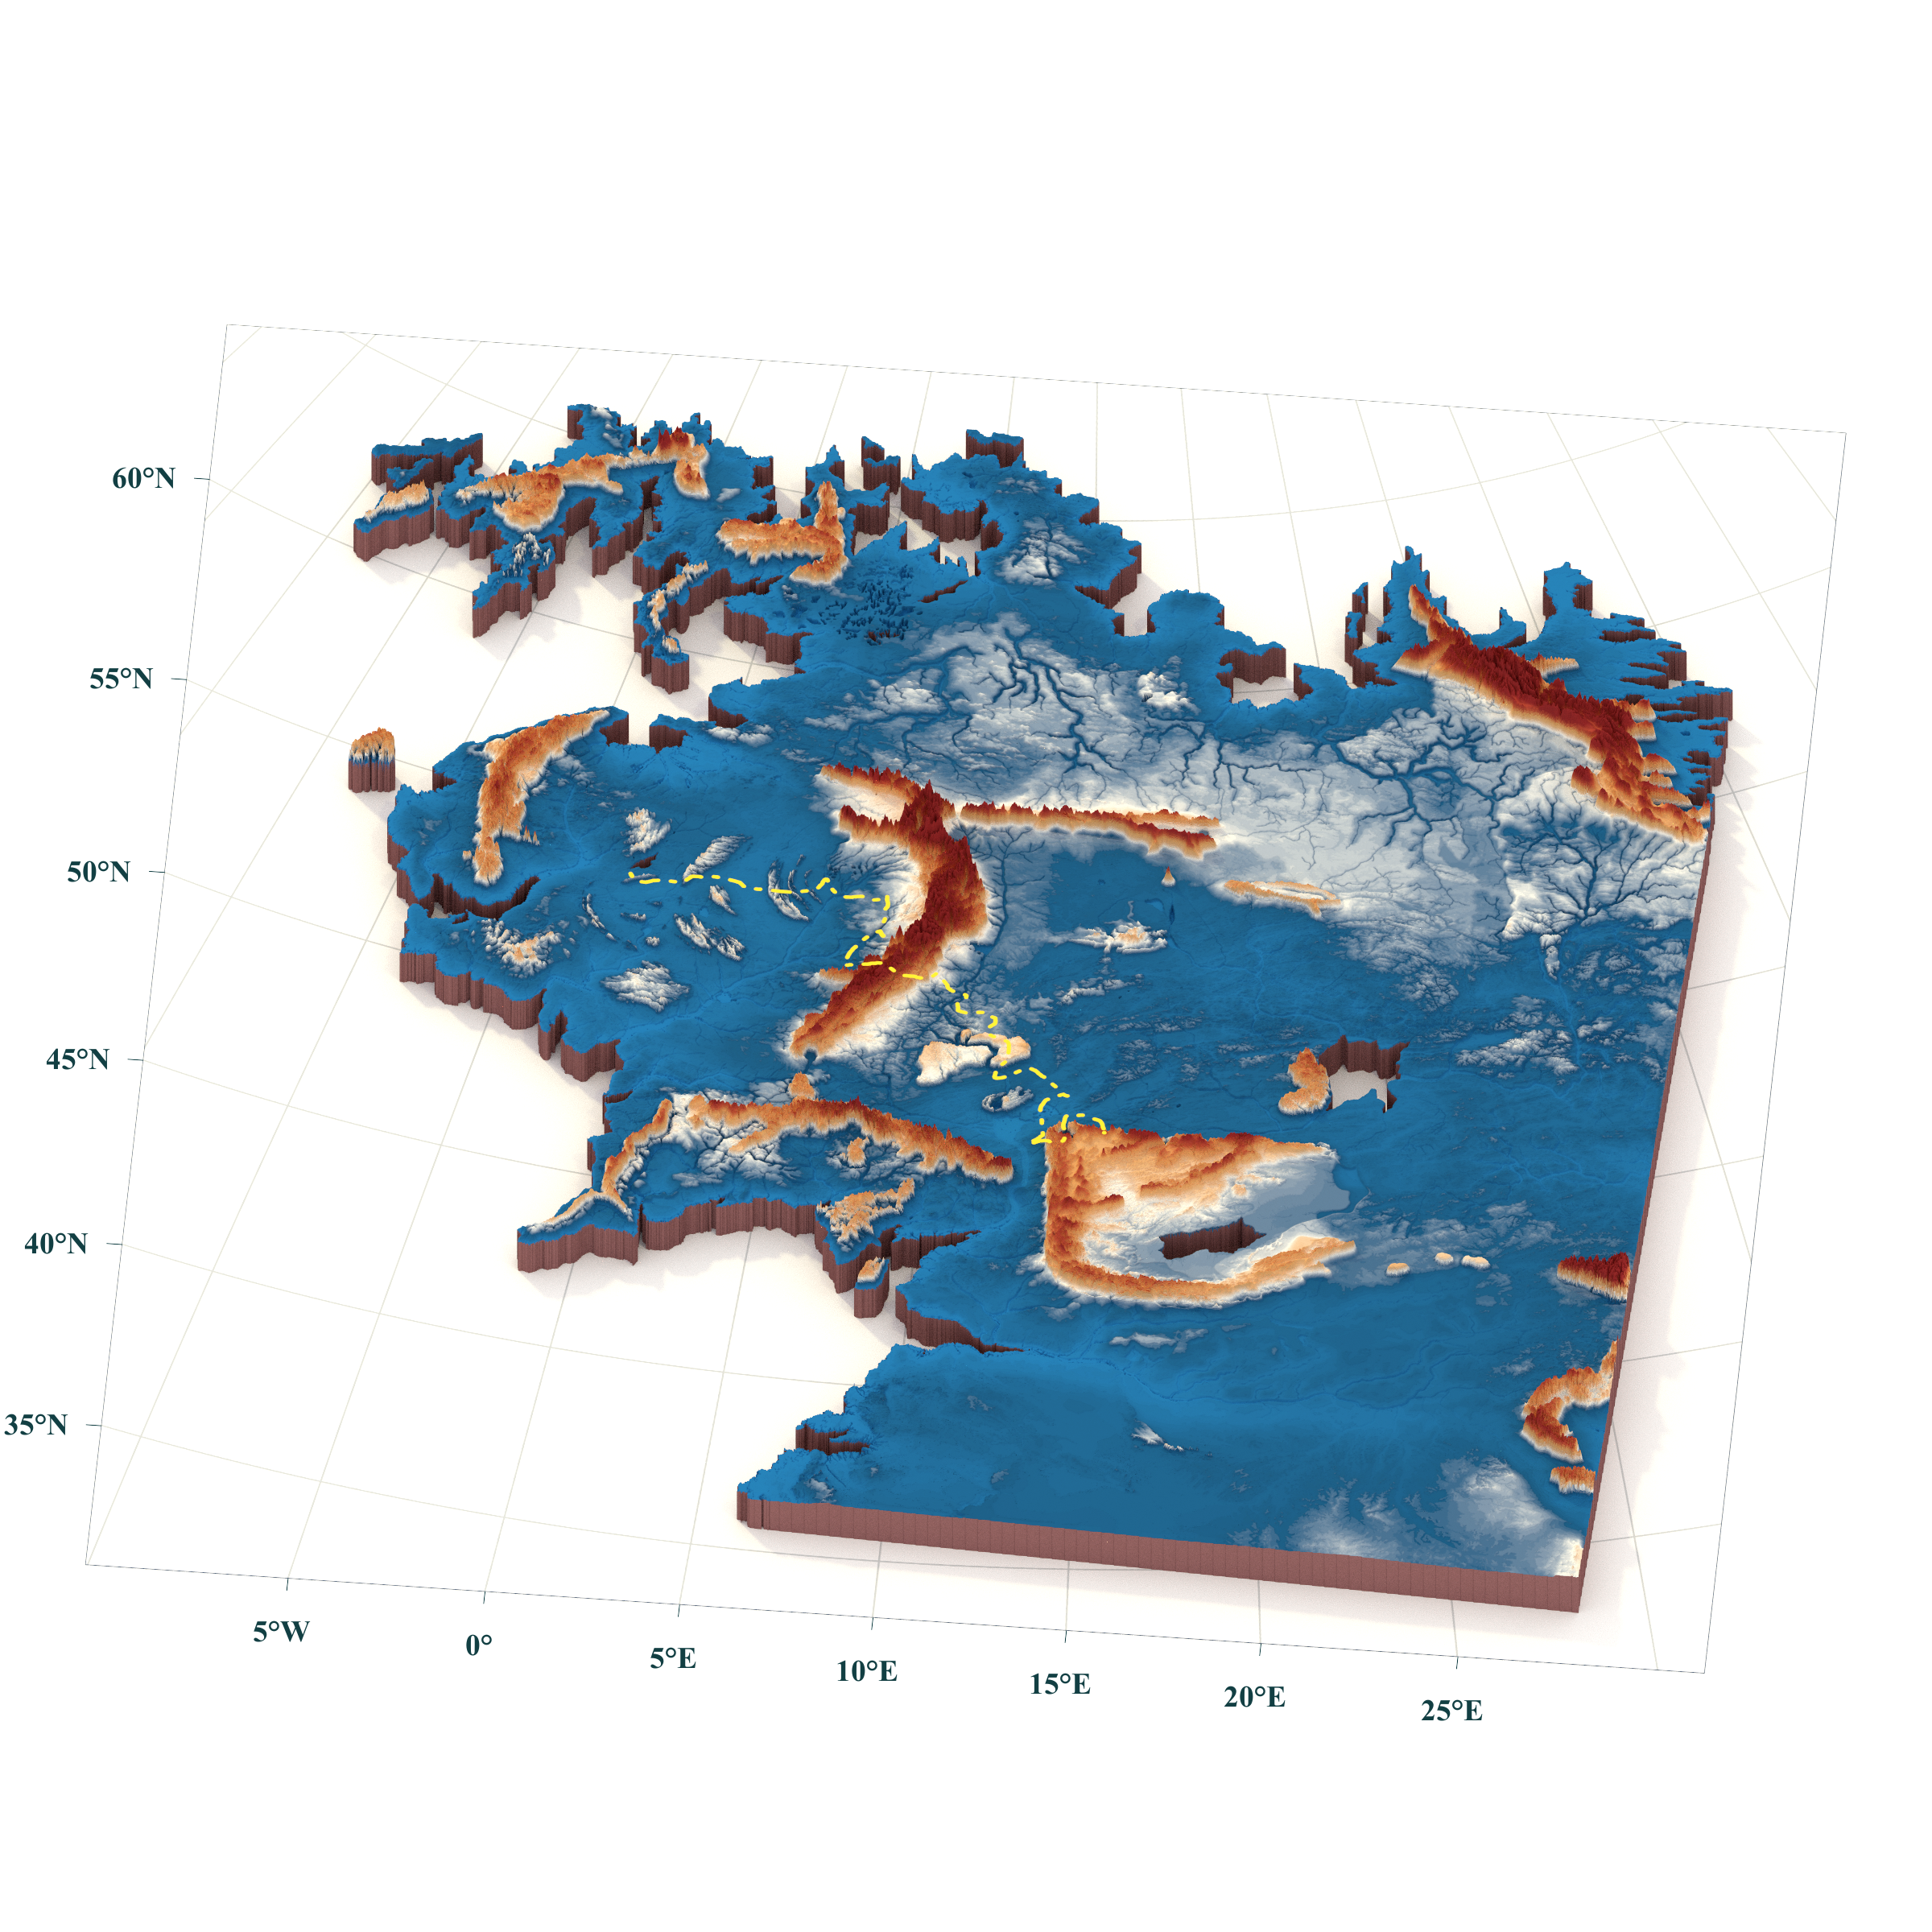
3D map of Middle-earth with visualization of Frodo & Sam’s journey
Here are the descriptive statistics of the journey:
| Indicator | Value | Info |
|---|---|---|
| Total journey distance | 2,522.9 km | |
| Cumulative ascent | 25.697 km | |
| Cumulative descent | 23.452 km | |
| Highest point | 2 346 m a.s.l. | 2,522.9 km from the beginning |
| Steepest continuous climb | 16.0 km | +1,367 m, from 624 m to 1,992 m; average gradient: 8.5%; position along the journey: middle third |
| Terrain category | Length (km) | Percentage of route |
|---|---|---|
| Gentle terrain (up to 5°) | 2011.0 | 82.29% |
| Hilly terrain (5–15°) | 375.0 | 15.34% |
| Steep terrain (15–30°) | 55.9 | 2.29% |
| Very steep terrain (over 30°) | 2.0 | 0.08% |
Since the most challenging part of Frodo and Sam’s journey comes at the very end, in Mordor, let’s use a few tricks in QGIS and Python—some cutting, merging, and then back to RayShader.
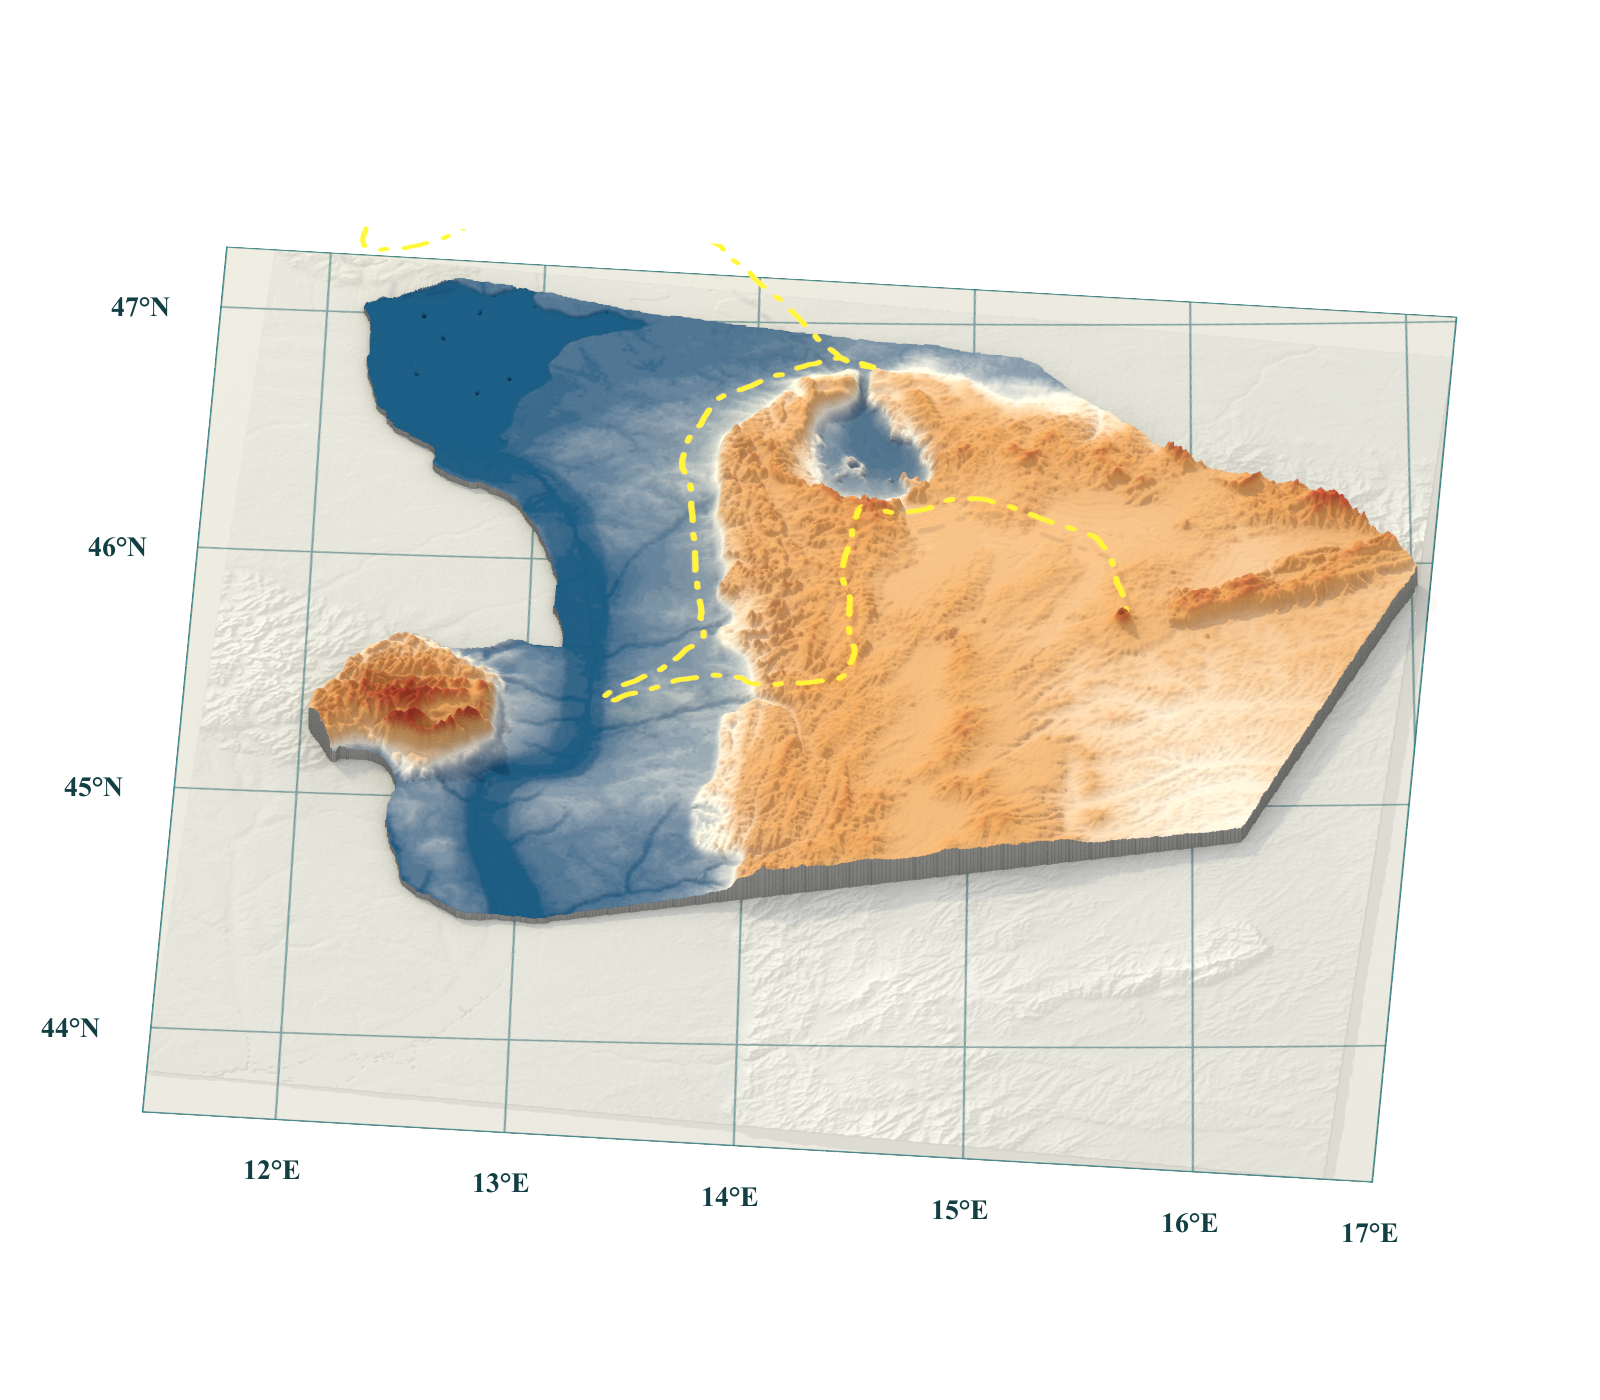
Dramatic end of Frodo and Sam’s journey.
Would a Lórien cloak keep me dry in the Ephel Dúath?
Now comes the time to check annual precipitation and temperature data over Middle-earth. I always love to see Rayshader maps and especially Bivariate ones – showing a combination of temperature and rain. You will learn a lot. The combination gives you a quite good impression of the relative environmental aspects of a larger area. The following visualization shows the results for ME and I am quite happy with that. The mountain mass and continentality work quite well. There is quite a nicely visible rain shadow behind the Misty Mountains – rain-abundant Rohan and Gondor, and almost dry Rhovanion, where steppes can probably be found. Moreover, I really enjoy seeing that subtropical high-pressure system working just fine, and south of Harad is a really dry area, even near the sea (a similar pattern can be seen in Morocco). And yes – Lórien cloak is needed in the Ephel Dúath! 😁
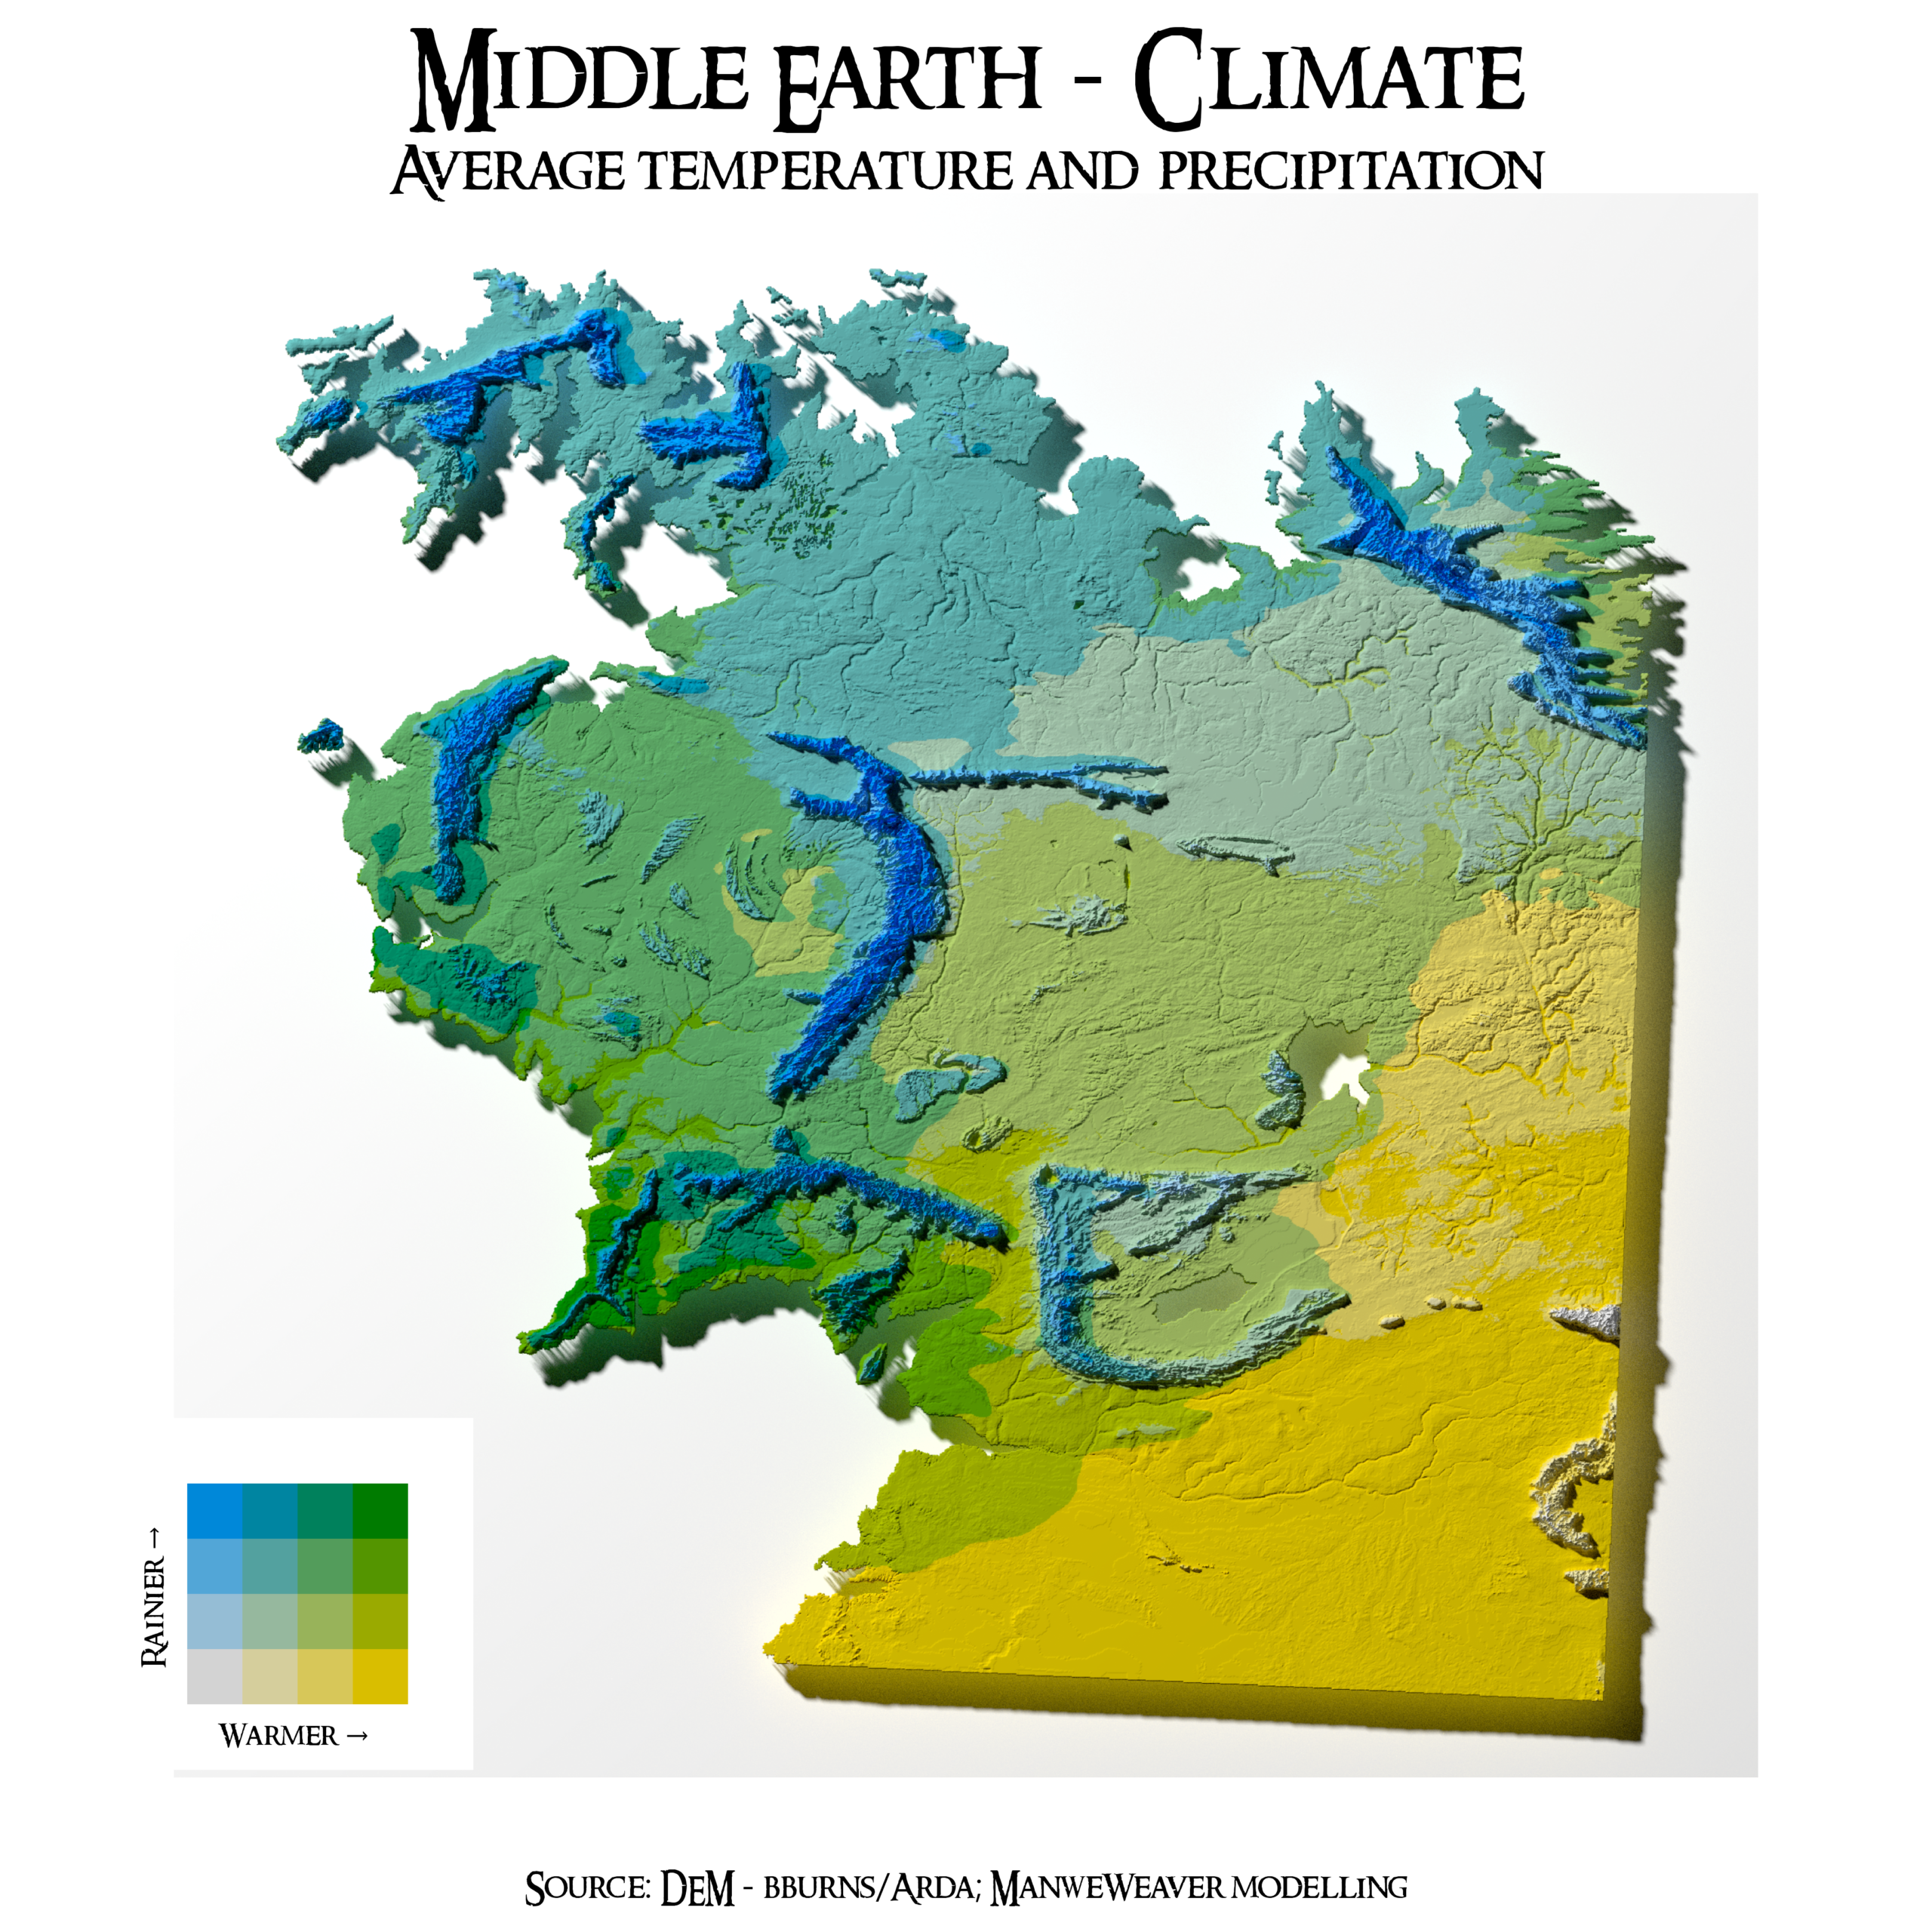
Bivariate map of precipitation and temperature of the ME
Where Would Hobbits Settle Based on Holdridge Life Zones?
The precipitation and temperature map shows us how western winds can bring moisture to Middle-earth and create various zones if we consider different temperatures. But could this result be somehow classified? Leslie Holdridge published in 1947 a global bioclimatic scheme for the classification of land areas, now called the Holdridge life zones system. It is a system for classifying ecosystems based on climate. Zones are calculated using three main variables: biotemperature, annual precipitation, and potential evapotranspiration ratio. The combination of these variables determines the life zone, such as tropical dry forest, temperate moist forest, or desert. So let’s see what we will find in Tolkien’s realm.
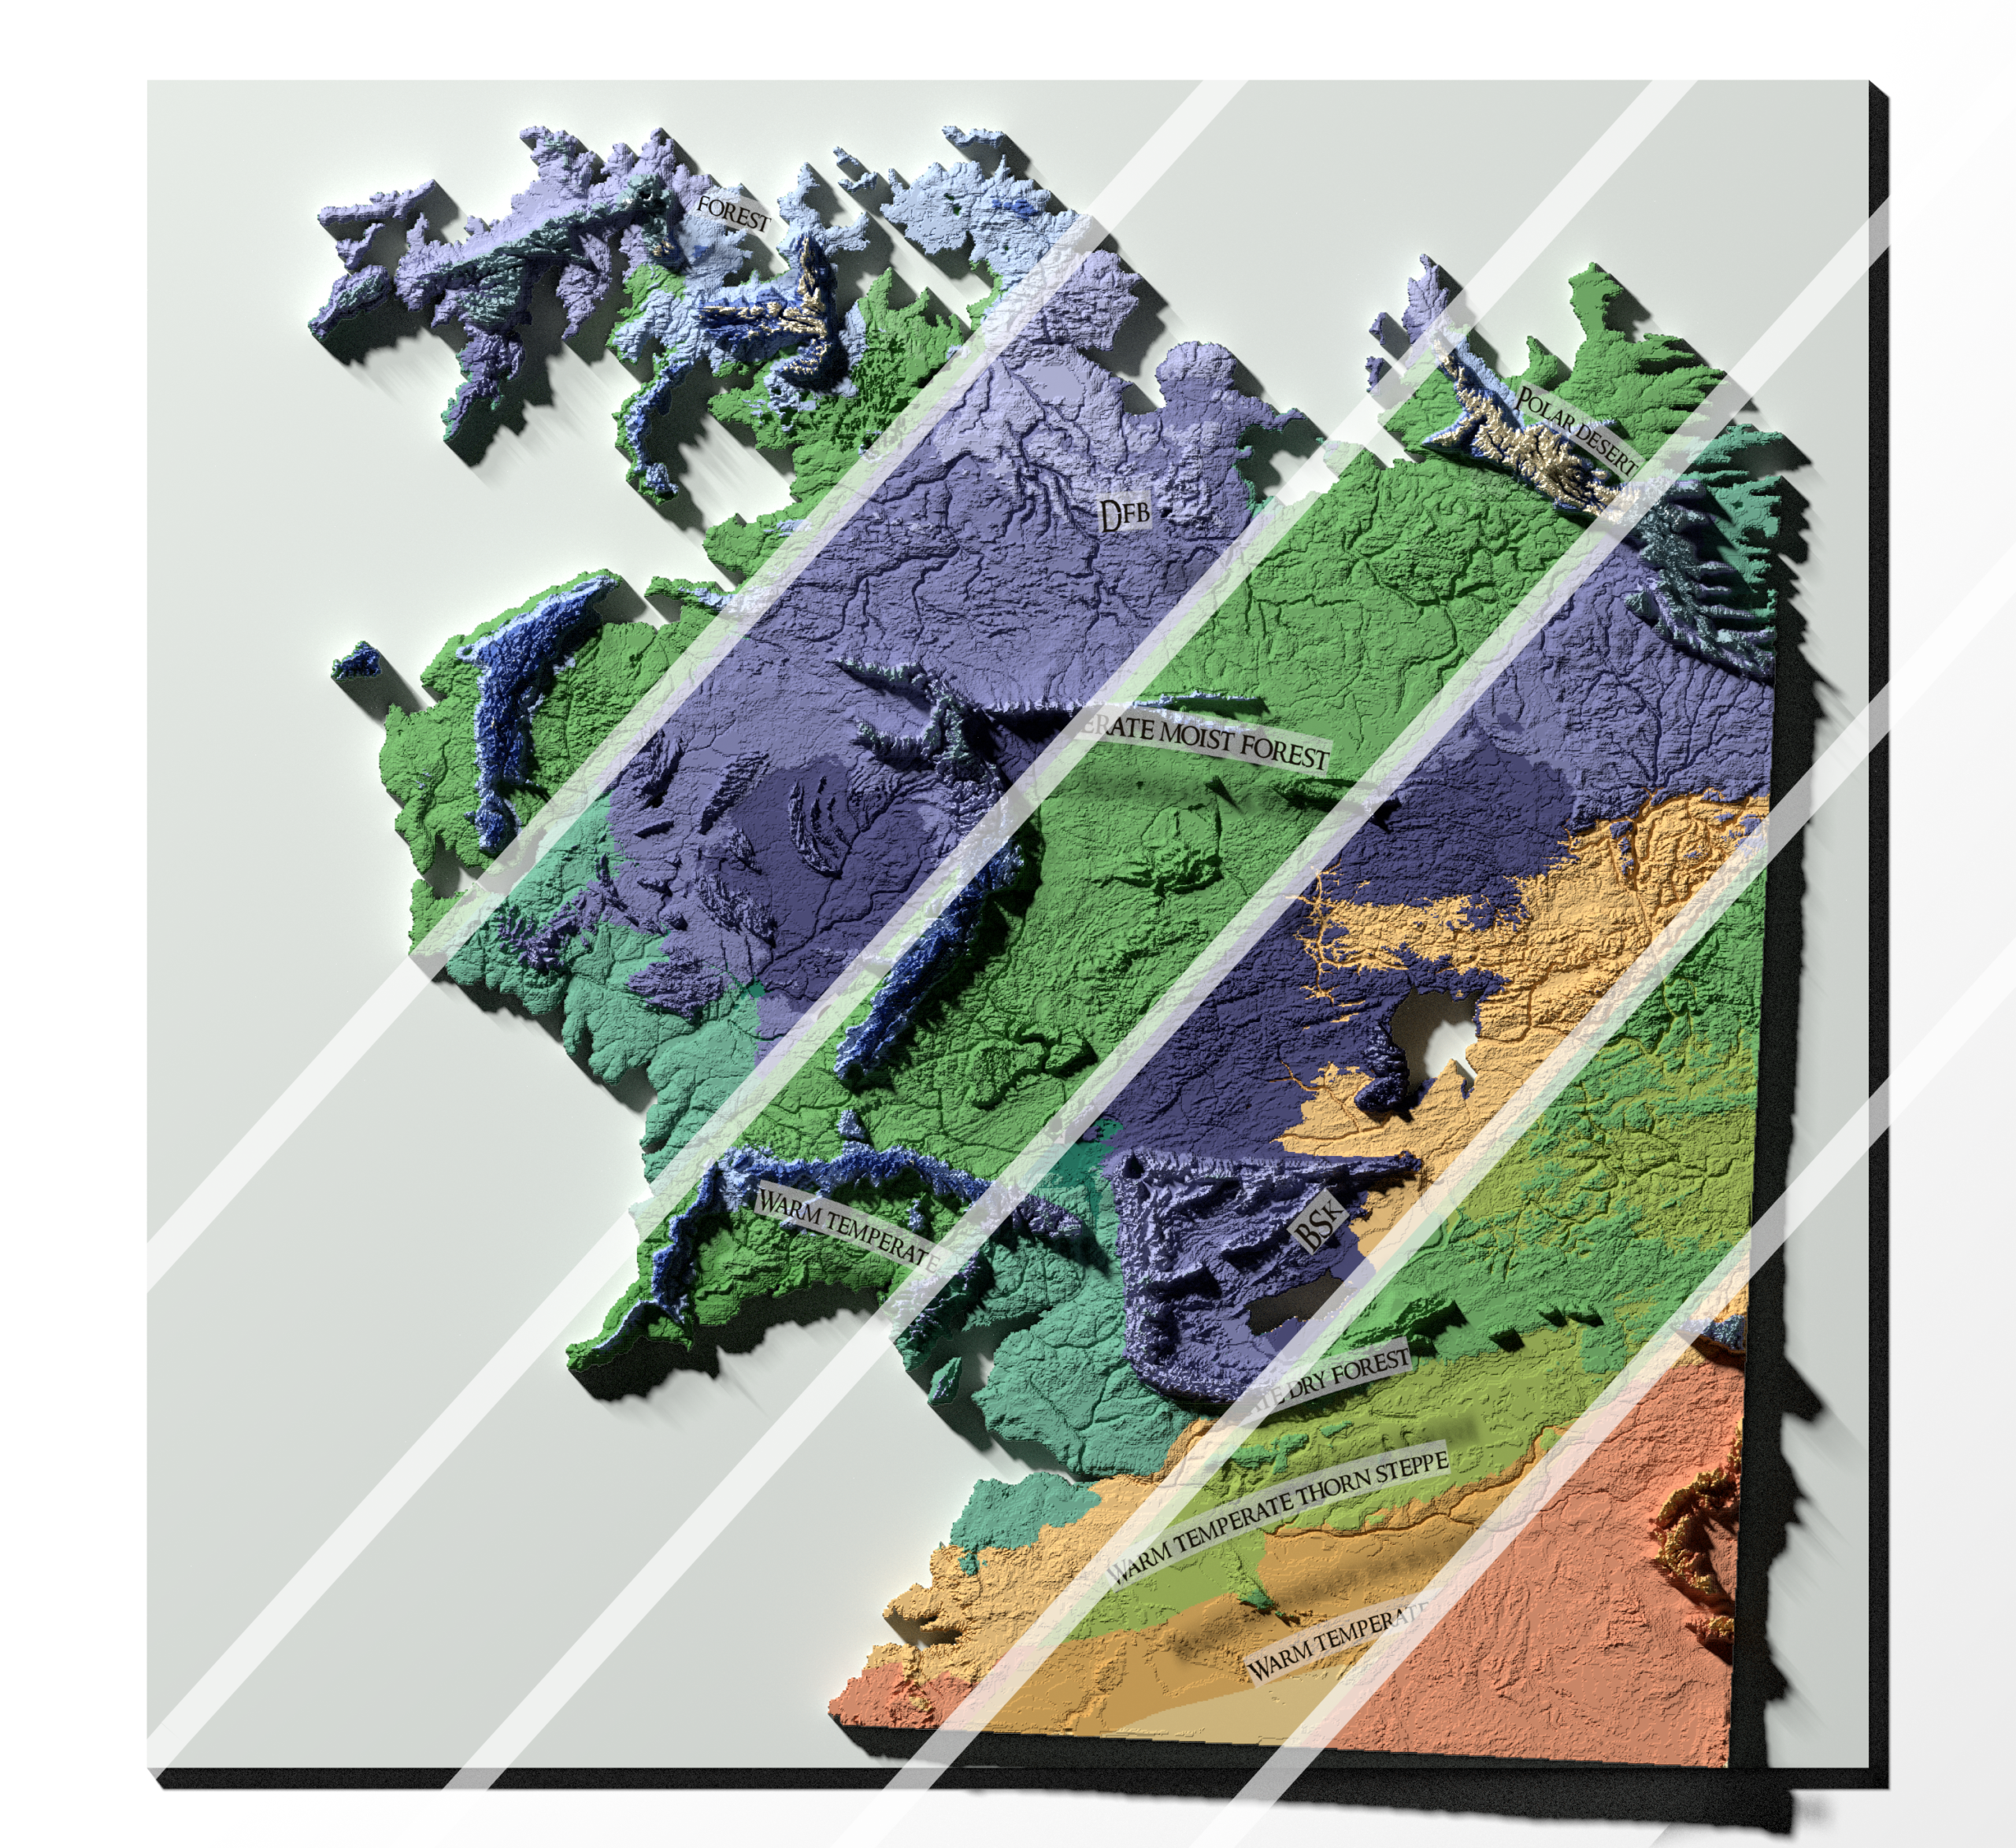
In the infographic below the main visualization, you can see that most of the area would be covered by Cool temperate moist forest (4 640 325 km² – almost 59 times the size of the Czech Republic). This life zone is characterized by a relatively cool climate, with mean annual biotemperatures of about 6–12 °C and annual precipitation of roughly 500–1,000 mm. These conditions provide sufficient moisture to support predominantly forest vegetation, while the relatively low temperatures distinguish it from warmer temperate forest zones. Interestingly, this aligns with Elrond’s description of Middle-earth’s extensive forests in the past: “Time was when a squirrel could go from tree to tree from what is now the Shire to Dunland west of Isengard.”
The second most extensive life zone is Warm temperate dry forest, covering 658,644 km². It can be found mainly in two areas — south of Mordor and in eastern Middle-earth, south of the Sea of Rhûn. I am not entirely satisfied with this result, as I would expect parts of the east to be covered by steppe, probably Cool temperate steppe. The rest of the zones seem quite reasonable to me, but I need to let this particular result settle for a while and revisit the analysis later. Where would Hobbits settle? That’s quite a tricky question, and probably more data science is needed. Especially machine learning models should be involved! As you can see so far, there are so many good choices for where to spend a good life in a hobbit-hole!
By the way, you can compare this map with the Holdridge Life Zones (1992) dataset published by the UN Environment Programme World Conservation Monitoring Centre.
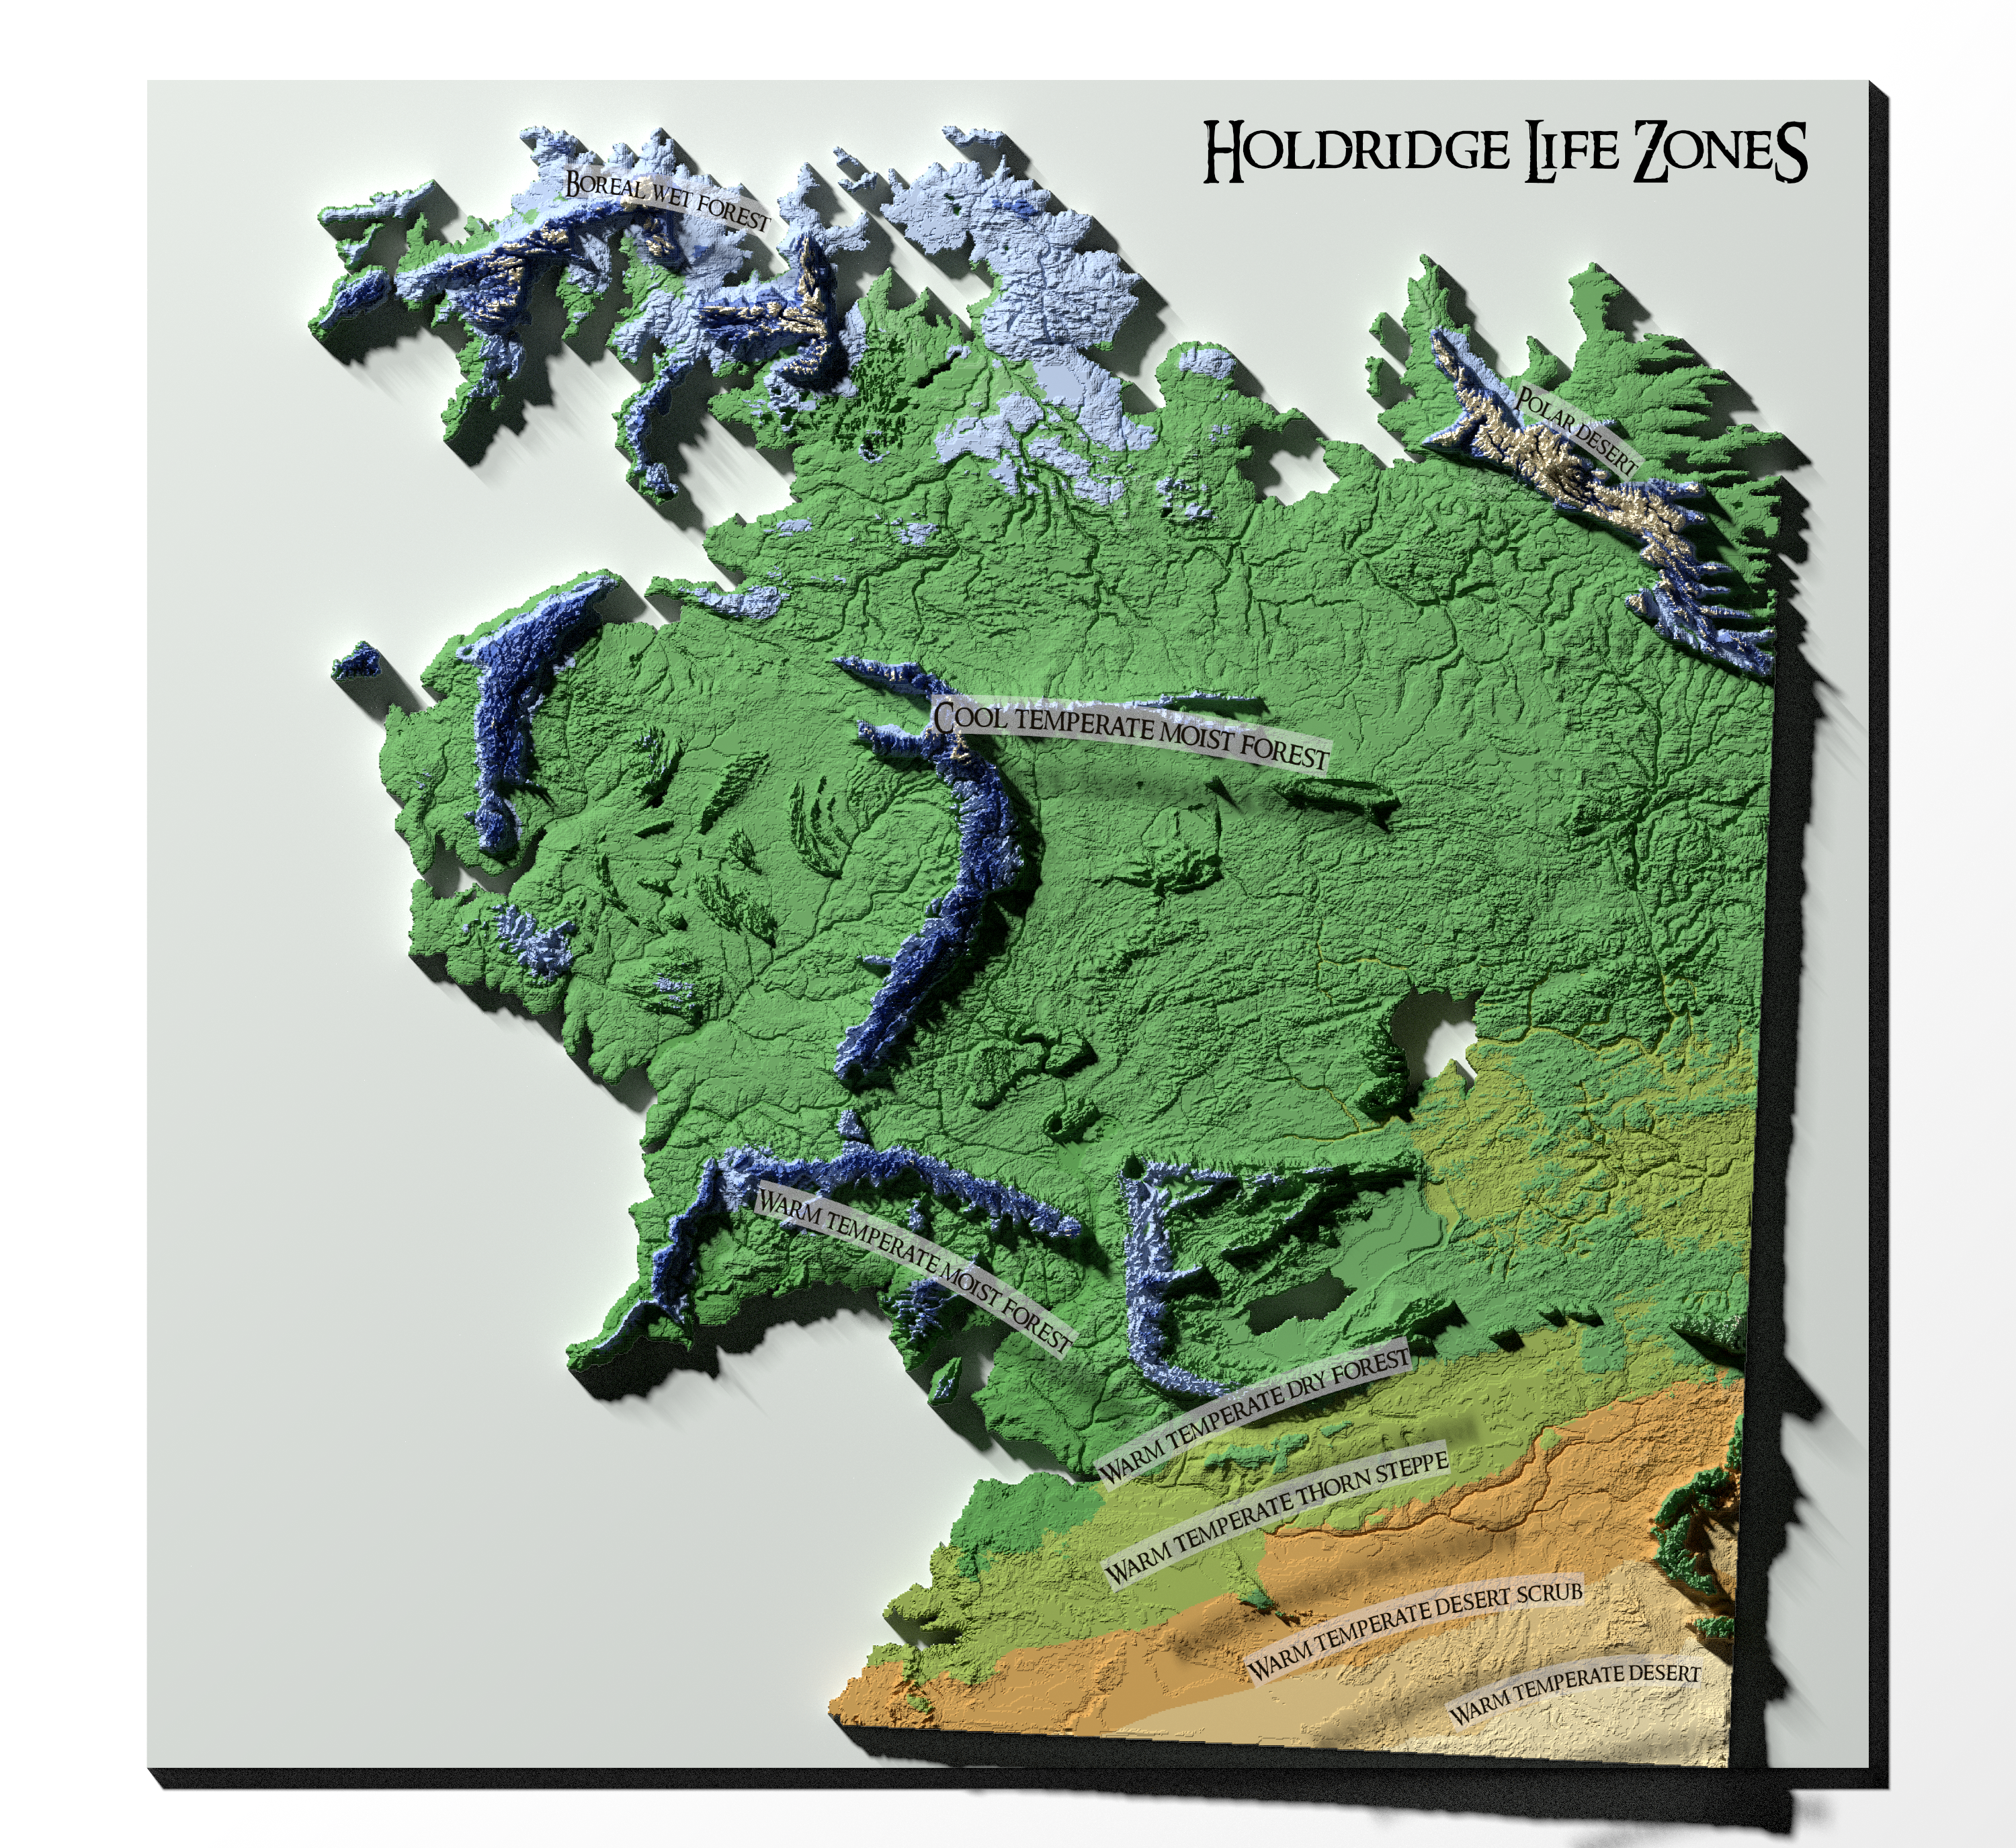
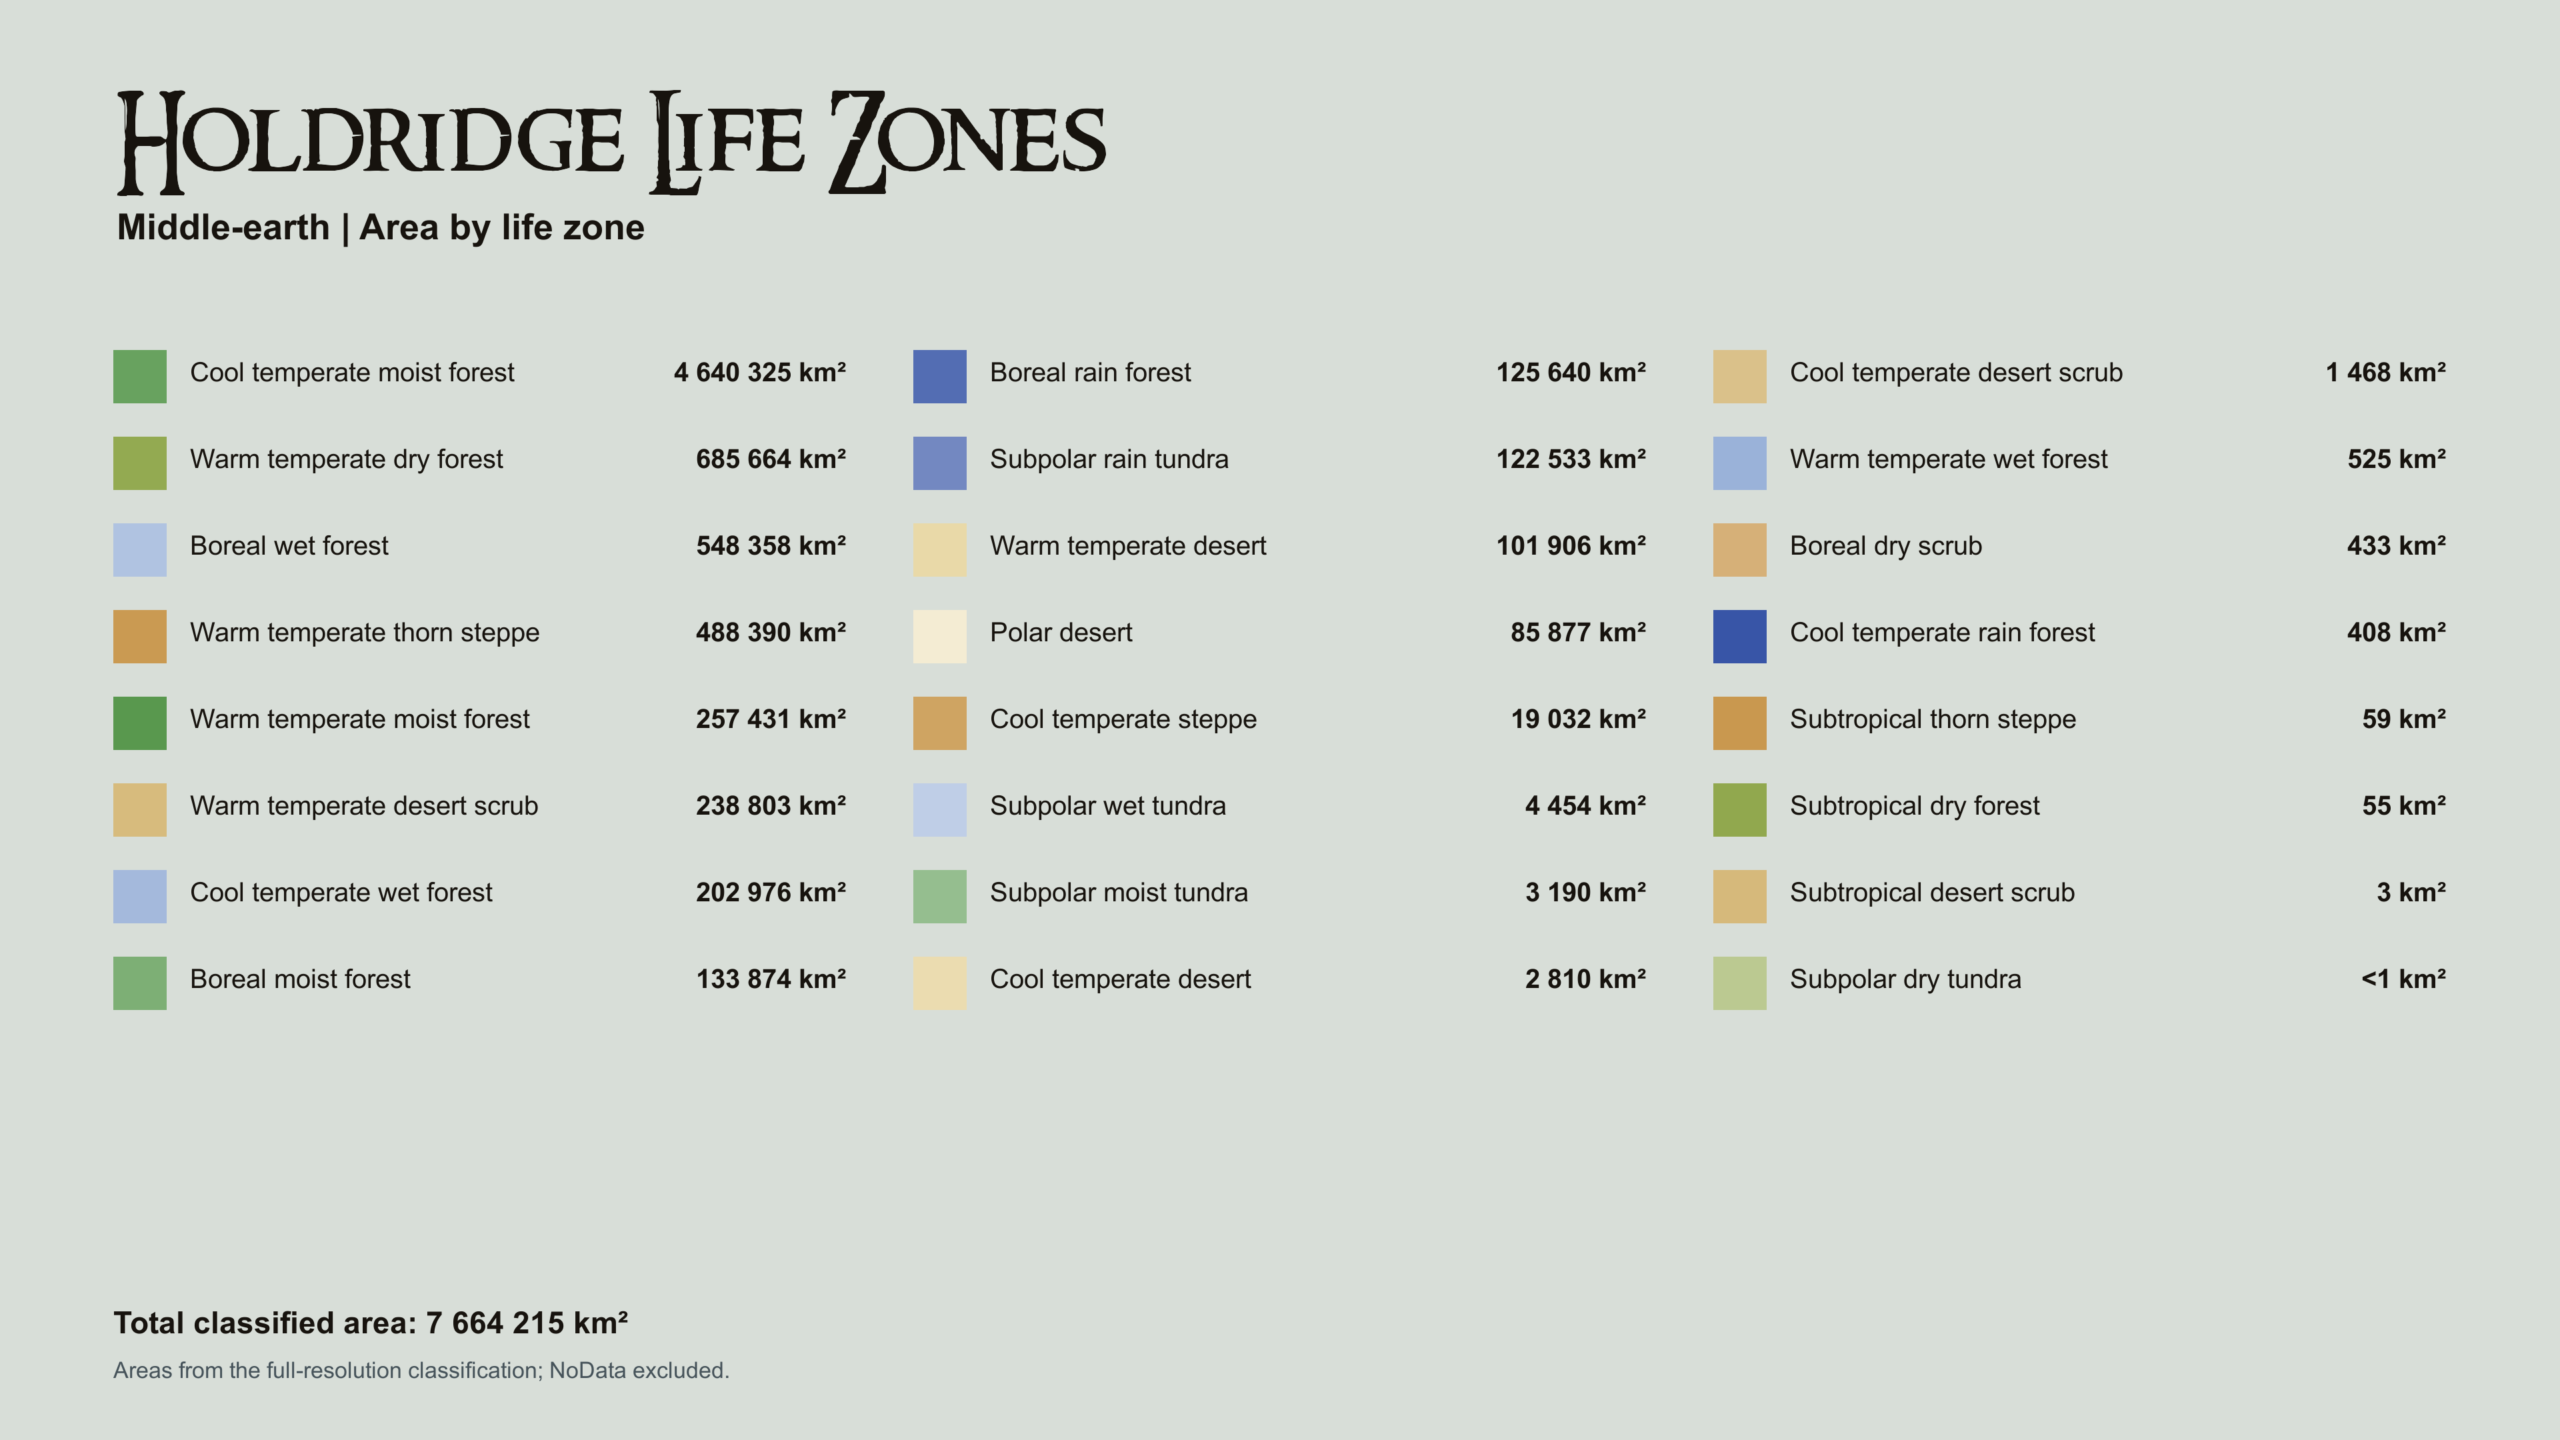
Holdridge Life Zones of the ME
Köppen–Geiger: Climate Labels for the Regions of Middle-earth
The Holdridge life zones give us an idea of what kind of vegetation could potentially thrive across Middle-earth. But there is another way to look at its climate. The Köppen–Geiger climate classification divides the world into climate zones based primarily on temperature and precipitation and their seasonal patterns. The system distinguishes five major climate groups — tropical, arid, temperate, continental, and polar — which are further divided into more specific types such as hot desert, Mediterranean, or humid continental climates. So, what would the familiar regions of Middle-earth look like via analysis of Köppen and Geiger?
As you can see, Köppen–Geiger classes are represented by combinations of two or three letters. Most of Middle-earth is covered by Dfb (2,274,485 km²) — a humid continental climate with warm summers. It is characterized by large seasonal temperature differences, with warm summers, cold winters, and precipitation distributed throughout the year. Snowfall is common during winter, while summers are generally mild to warm. Dfb, together with types such as Dwb and Dsb, is associated with hemiboreal climates. These areas can be found in Canada, Norway, Sweden, or in the Southern Alps in New Zealand’s South Island. Hmm, did Peter Jackson use this type of classification? 🤔
The second most extensive class is BSk (1 340 840 km²) – Cold semi-arid climate featuring warm to hot dry summers. This climate tends to have cold and optionally freezing winters. These areas can also experience snowfall in winter. Quite importantly for travellers such as the Blue Wizards, these climates can experience substantial temperature swings between day and night, sometimes reaching 20 °C or more. In our world, BSk climates can be found across large parts of Central Asia, as well as parts of the Middle East and southern Ukraine.
What I found particularly interesting is the very large extent of BWk (901,356 km²) — the cold desert climate. This climate is characterized by dry conditions and relatively high temperatures, though it is not as hot as BWh (hot desert climate). Winters can be cold and dry, as BWk climates are typically found at higher altitudes than hot deserts and are often associated with temperate regions around 30–40° latitude, particularly in the rain shadows of high mountains.
I wonder why almost all of Harad is classified as BWk rather than BWh. Perhaps it is related to altitude or to seasonal variations in precipitation and temperature. After all, these values were derived from rather rough estimates so far, and I am planning to develop a more advanced approach later. Nevertheless, BWk might actually fit Harad better than BWh, as I imagine the region somewhat like Morocco.
Again, you can compare this map to the Earth’s distributions of climate classes: https://koppen.earth/
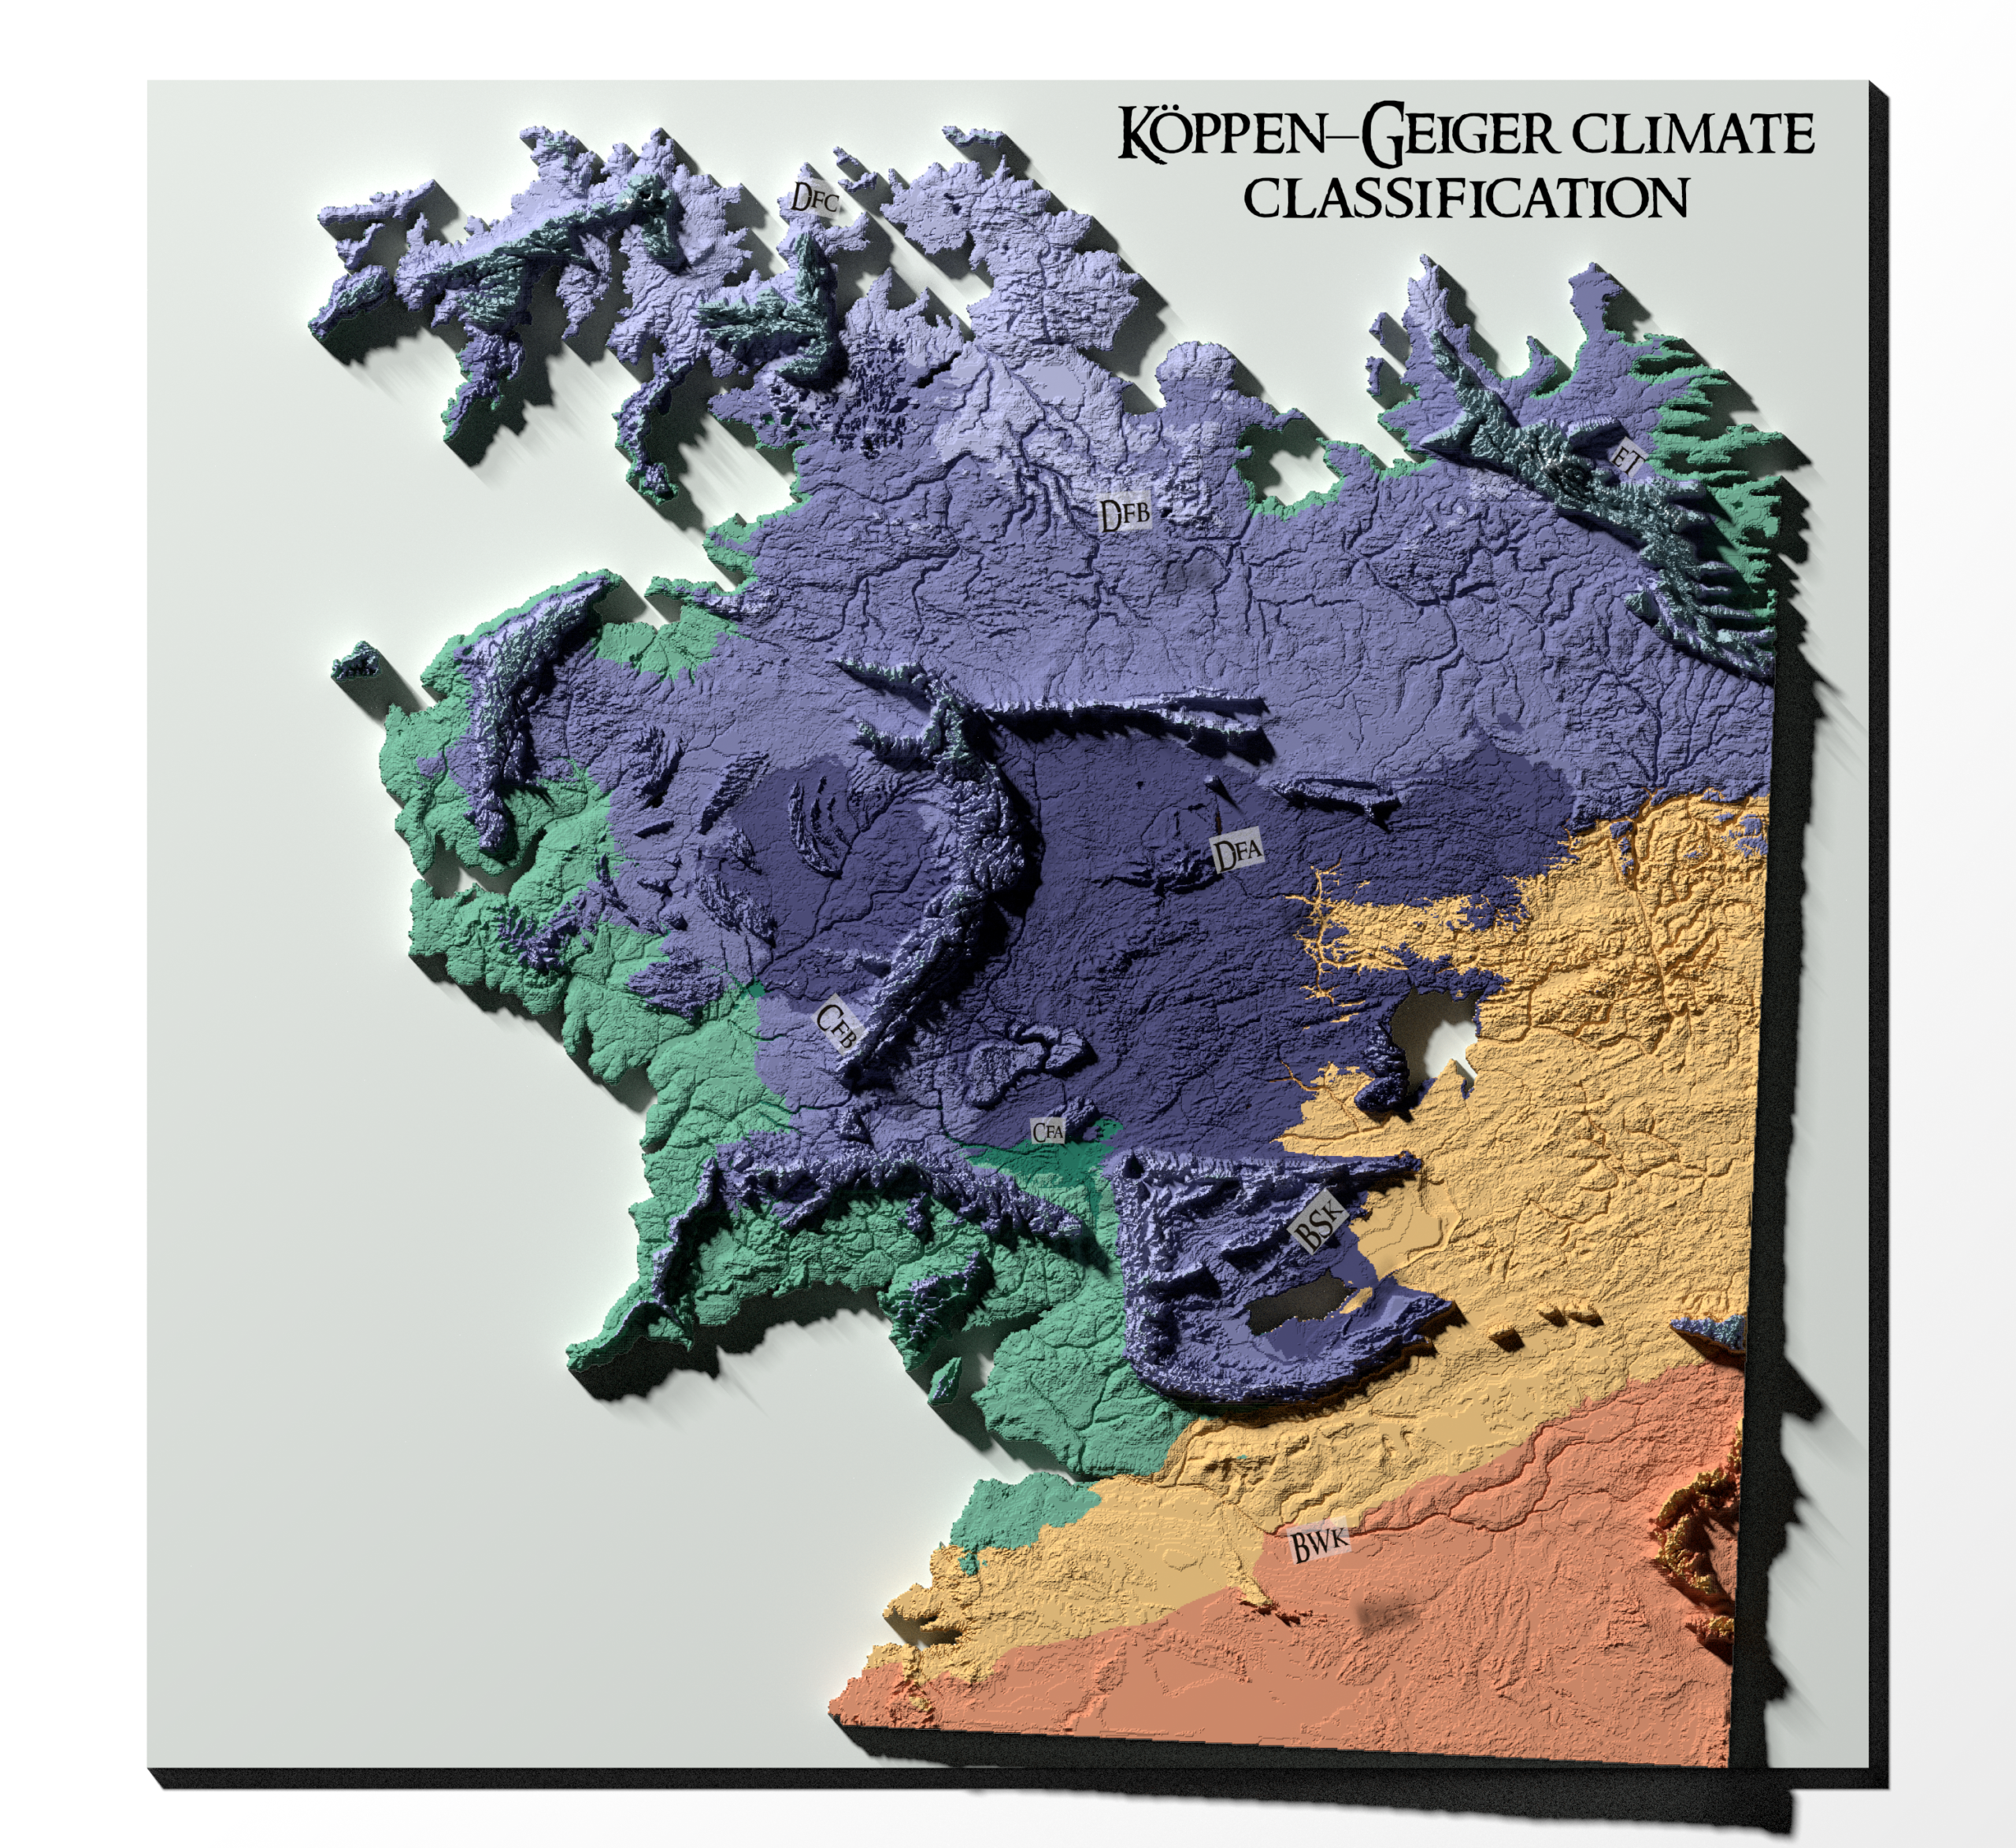
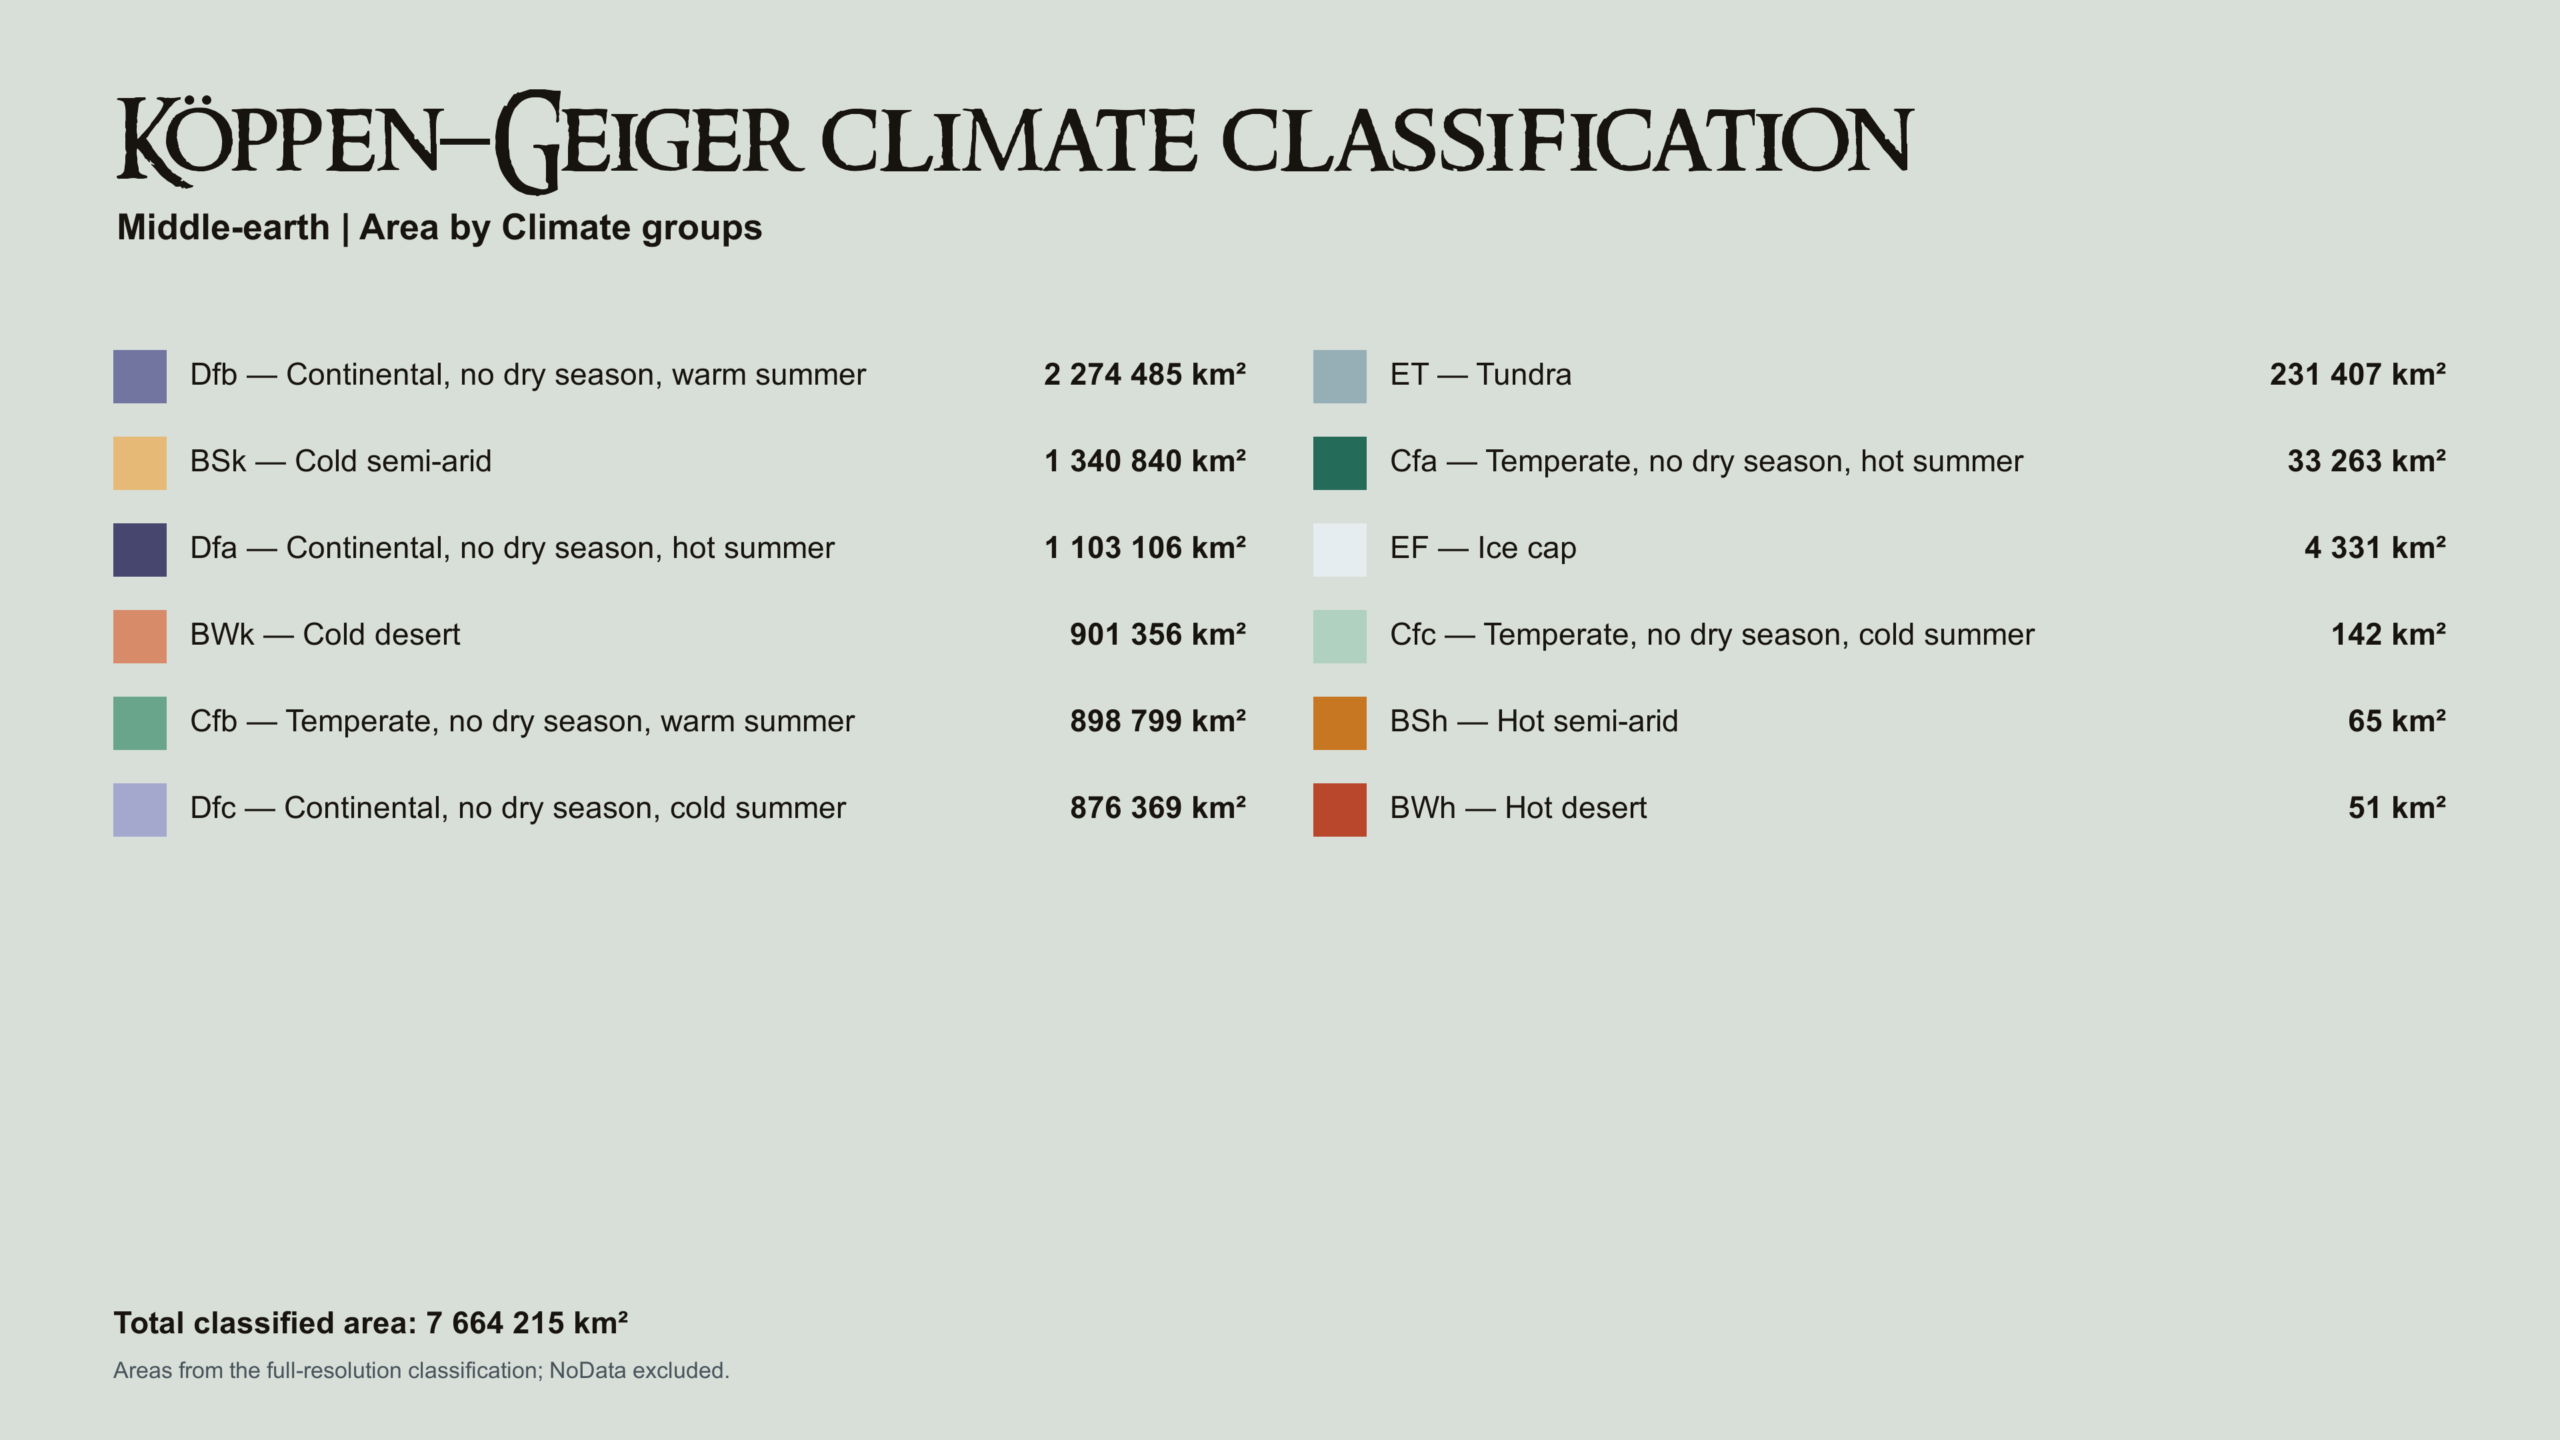
Köppen–Geiger Climate Classification of the ME
Where Else Can We Find Midgewater Marshes Using the Topographic Wetness Index?
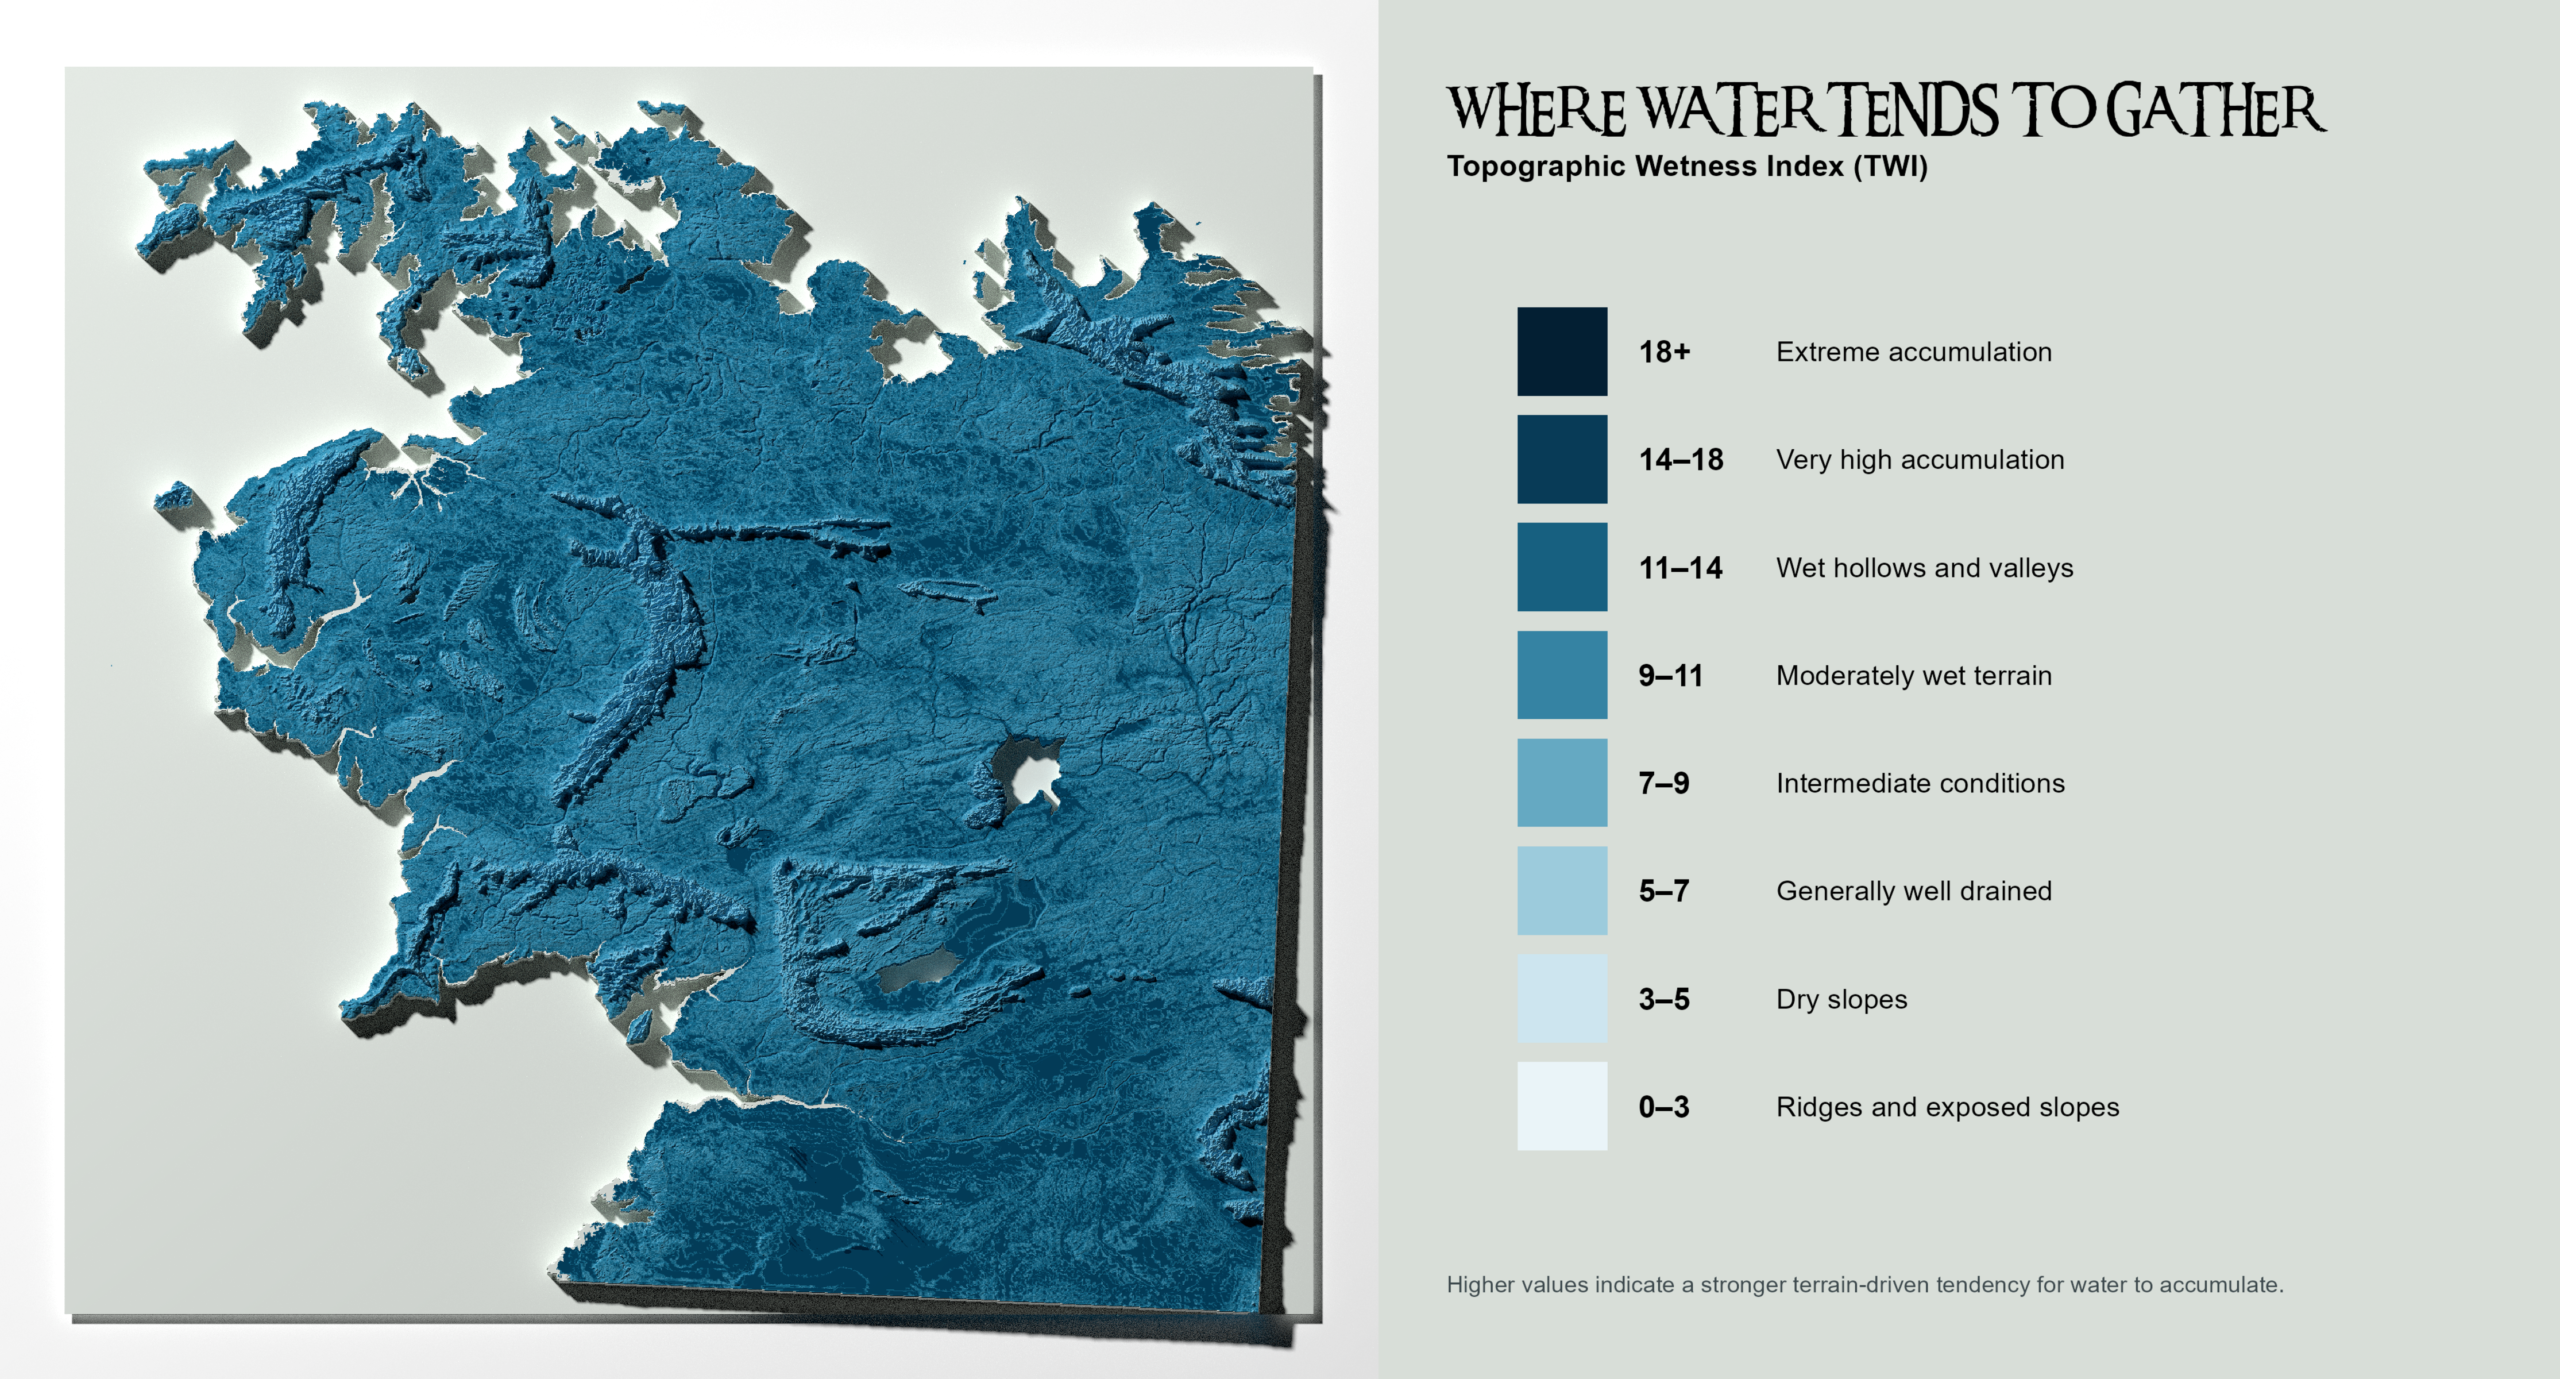
The last analysis will return to products related more to topography than climate. I often use the Topographic Wetness Index (TWI) for different analytical purposes in my work. Thus, I am quite interested in how well the TWI will assess the DEM and its capability to drain the terrain. So firstly – what is TWI? It is a terrain-based indicator used to estimate where water is likely to accumulate based on local slope and upstream contributing area. Higher TWI values generally indicate wetter areas with greater potential for soil saturation, while lower values represent better-drained or steeper terrain.
I found it quite interesting that we can find many places similar to Midgewater Marshes in Central Eriador. Some of them are not so relevant if you put them into the context of precipitation, though there are large areas which could be potentially suitable for lakes, swamps, or marshes. So large areas in Harad with very high accumulation are probably not relevant, as we are talking about the desert, but what about areas in the vicinity of Lonely Mountain and more distant locations east of it (North of Iron Hills)? This is quite suspicious, and I need to think what conclusion I should make of it! Anyhow, I think that there are lots of potential fishing places for Gollum on his journey to run away from Gandalf (I can’t wait for the movie)!
Beorn’s Pantry of Natural Wonders: What Else Can We Read from the Terrain?
“All we have to decide is what to do with the time that is given us.”
— Gandalf, The Fellowship of the Ring
After so much analysis, I must say I am quite exhausted. I still feel that I should add this and that, and I keep thinking that I should rerun the whole modelling because Köppen–Geiger or Holdridge Life Zones are not showing some of the zones and climates that I expected to see on the maps.
Nevertheless, I should put my perfectionism aside, wrap things up, and put all the additional ideas on the to-do list. There are so many things that can be done with just a DEM and a little bit of fantasy — environmental, agricultural, or even social aspects! In due time, I will return to them and carefully choose what to do next, following Gandalf’s wise words!
To-do list:
- River basin and floodplain analysis using relevant Python libraries
- Better seasonal variation of temperature and precipitation
- Holdridge and Köppen–Geiger rerun
- Advanced georeferencing
- Better colour palettes for Holdridge and Köppen–Geiger
- ExoPlaSim simulation of Middle-earth (!)
- Machine learning applications
And so on! There are many more items on the to-do list, but these are the most important ones!
Should We Sail West, or Stay and Keep Modelling?
With the efforts of John Cook et al. in mind, I am thinking about how this project could be transformed into something more valuable in the future. For now, it is just something I do for fun in between work and everyday life as a huge Tolkien fan, happy to see that even an ordinary DEM map can tell an interesting story.
For the time being, I am going to use some of these maps in our The One Ring TTRPG sessions. I have also learned quite a lot about Rayshader and georeferencing (which I had never done before), and about how a fictional realm can be treated as part of a planet with Earth’s orbital characteristics.
I have several scenarios in mind for how to take this topic further. Some of them are related to the gaming sector, some to my story writing, and others to educational purposes.
Anyhow, I think I will stay in Middle-earth for a while longer and keep modelling!
Until our paths cross again — farewell, and may your path lead through warm, dry, and cosy biomes! 🌿🧙♂️🗺️✨